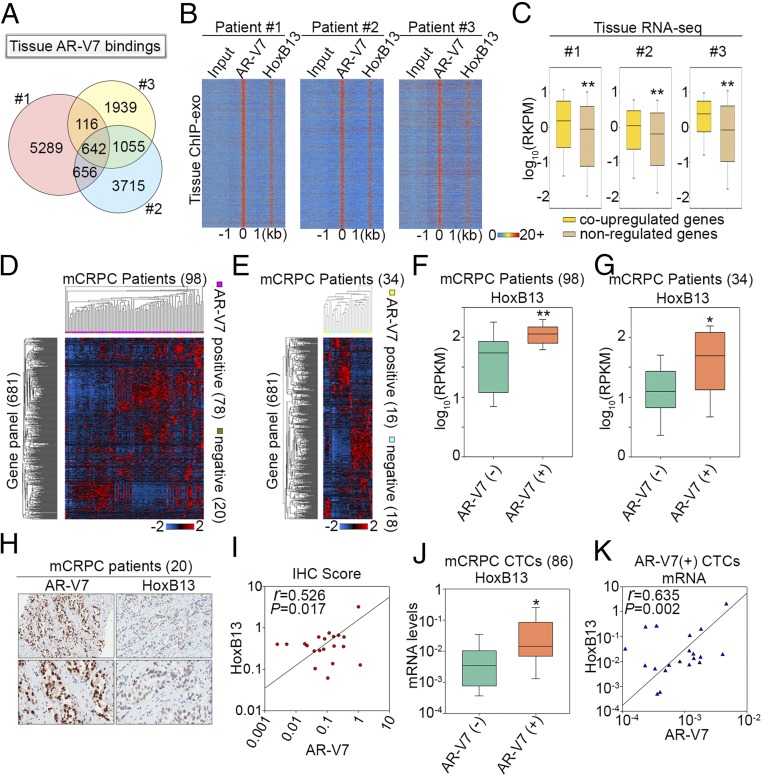
Fig. 4.
HoxB13 and AR-V7 coregulate transcriptomic diversity among CRPC patients. (A) A Venn diagram shows AR-V7 binding site diversity between the three CRPC patients. (B) Heatmaps show the ChIP-exo signal intensity of AR-V7 and HoxB13 binding in three CRPC patients. (C) Box plots compare expression of genes associated with tissue AR-V7/HoxB13 binding sites. Coup-regulated genes refer to genes that were also coup-regulated by AR-V7/HoxB13 in CRPC cells. (D and E) Heatmaps show expression of the 681-gene panel among the 98 metastatic CRPC (mCRPC) patients in the Robinson et al. (20) cohort (D), and 34 mCRPC cases in the Beltran et al. (21) cohort (E). (F and G) Box plots compare HoxB13 gene expression between AR-V7+ and AR-V7− patients in the Robinson et al. (20) cohort (F) and in the Beltran et al. (21) cohort (G), respectively. The significance was determined by Mann–Whitney rank sum test. *P < 0.01, **P < 0.001. (H) Representative AR-V7 and HoxB13 immunoreactivity in mCRPC tissues (Upper 20×, Lower 40× original magnification). (I) Correlation between AR-V7 and HoxB13 staining in 20 CRPC cases. Slides were scanned using an Aperio Digital Pathology Slide Scanner (Leica Biosystems) at 40× magnification and staining quantified using the Aperio Image Scope (v11). Data represent the ratio of positive pixels per total pixels from areas of tissue containing mCRPC. (J) A box plot compares HoxB13 mRNA levels in 86 CTCs from mCRPC patients. The significance was determined by one-tailed t test. *P < 0.05. (K) Correlation of mRNA expression between HoxB13 and AR-V7 in AR-V7+ CTCs.

