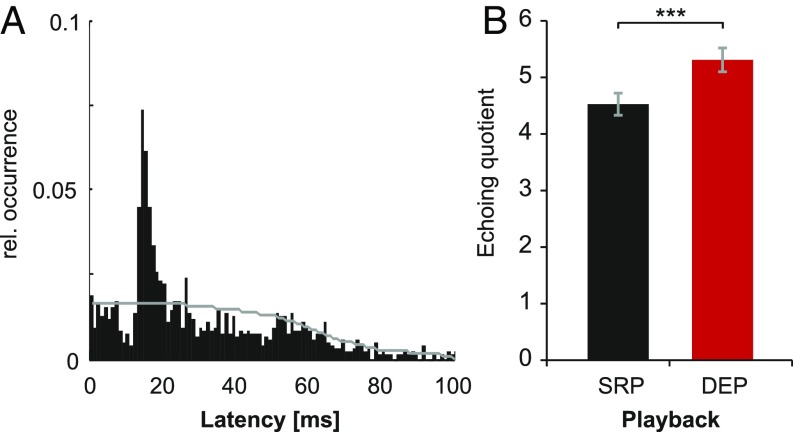
Fig. 2.
Echo responses to static and interactive electrical playback. (A) Exemplary depiction of the relative occurrence of EOD-response latencies of fish 9 during SRP. The horizontal line represents the expected distribution of response latencies. The observed latencies at the mode of the distribution exceed the expected distribution. Bin size: 1 ms. (B) Echoing quotient, i.e., the ratio of observed to expected latencies at the mode of the latency distribution (mean ± SEM). This proportion was higher in response to DEP for almost all of the n = 23 fish compared with SRP. ***P < 0.001.

