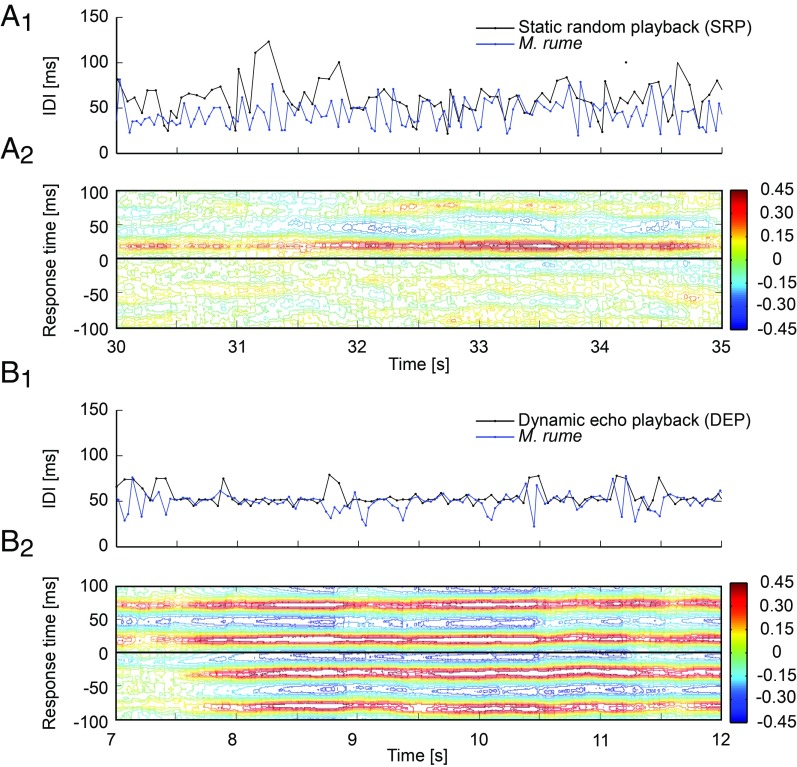
Fig. 3.
Synchronization of electrical discharge activity. Discharge synchronization of M. rume with SRP (A) and DEP (B). (A1 and B1) IDI sequences of playback (black) and fish (blue) over time (see SI Appendix, Figs. S3 and S4 for complete sequences). (A2 and B2) Cross-correlation diagrams calculated for each pair of IDI sequences displayed in A1 and B1. Correlation coefficients of the fish’s signals with the playback signals are color coded for response times of ±100 ms. High correlation coefficients at positive response times represent synchronization of the animal’s signaling behavior to the playback, whereas high correlation at negative response times represents synchronization of the playback with the signaling behavior of the fish. This can occur only randomly with SRP. High correlation coefficients at negative response times in B2 reflect the consistent synchronization of DEP with the signaling behavior of the fish.

