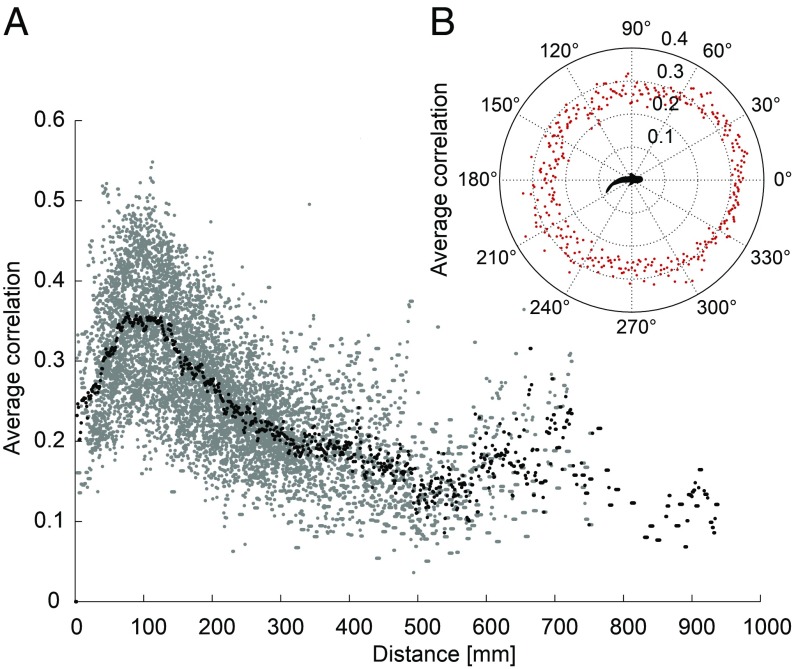
Fig. 5.
Electrical discharge synchronization and spatial interactions. (A) Cross-correlation coefficients of the IDI sequences of M. rume with SRP for n = 23 animals plotted against the distance between robot and fish observed at the respective time (gray dots). Average values per distance (black dots) show that synchronization was strongest at ∼100 mm. Bin size: 1 mm. (B) Polar plot of the average cross-correlation coefficients per 1° of the angle representing the robot’s bearings in the fish’s egocentric coordinate system. The distance from the center of the plot represents the correlation coefficient.

