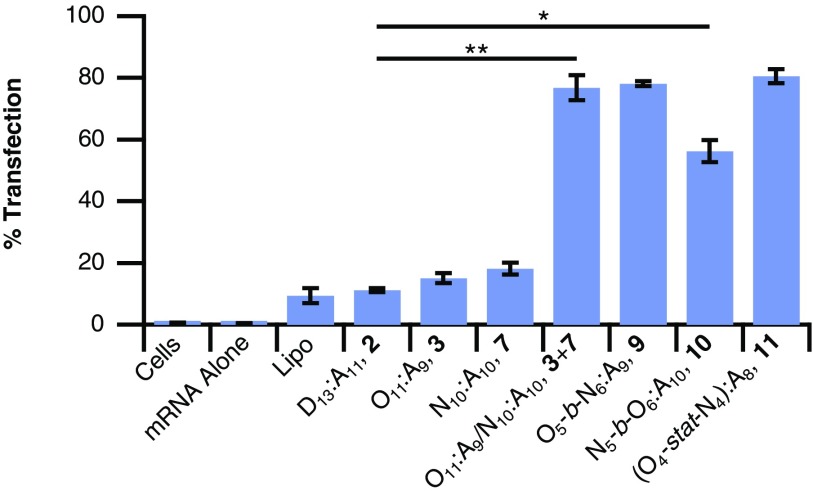
Fig. 6.
Performance of noncovalent (3 + 7) and hybrid-lipid CARTs (9, 10, and 11) for the delivery of EGFP mRNA to Jurkat cells, as well as baseline performance of Lipo and single-lipid CARTs (2, 3, and 7). All values represent the average percent of EGFP-positive cells from three separate experiments with error bars corresponding to the SD. Unpaired Student’s t test: *P < 0.0005, **P < 0.0001.

