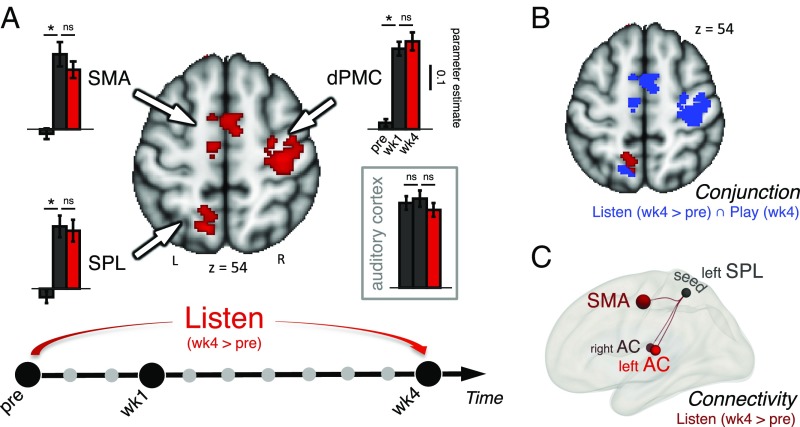
Fig. 2.
Training-related changes. (A) Functional activation changes during passive listening to the learned sequences across the 4 wk of training (SCAN wk4 > preSCNA). Contrast images are displayed with a cluster-based thresholding (z >2.3) corrected for multiple comparisons (P < 0.05). Enhanced activations are observed in regions of the dorsal auditory-to-motor pathway including a left parietal region (SPL), SMA, and the dPMC. Insets show bar plots of BOLD signal within the three regions of the dorsal pathway (indicated by arrows) across the preSCAN, SCAN wk1, and SCAN wk4 scans (*P < 0.05. paired-sample t tests after Bonferroni correction). No significant differences (ns) in parameter estimates are observed in regions of the dorsal pathway between week 1 and week 4 suggesting that the sensorimotor integration loop is already efficient after 1 wk of training. As a reference, no significant changes are observed within bilateral AC across scans. (B) Conjunction Play week 4/Listen week 4 >pre (in blue) superimposed with functional activation changes (week 4 > pre) during listening (in red; z >2.3). (C) Between-scans contrast of FC (week 4 > pre) shows increased connectivity between the SPL and the a priori-defined ROIs: the bilateral AC (specifically, the PT) and SMA (Methods) (P < 0.05 FDR-corrected).

