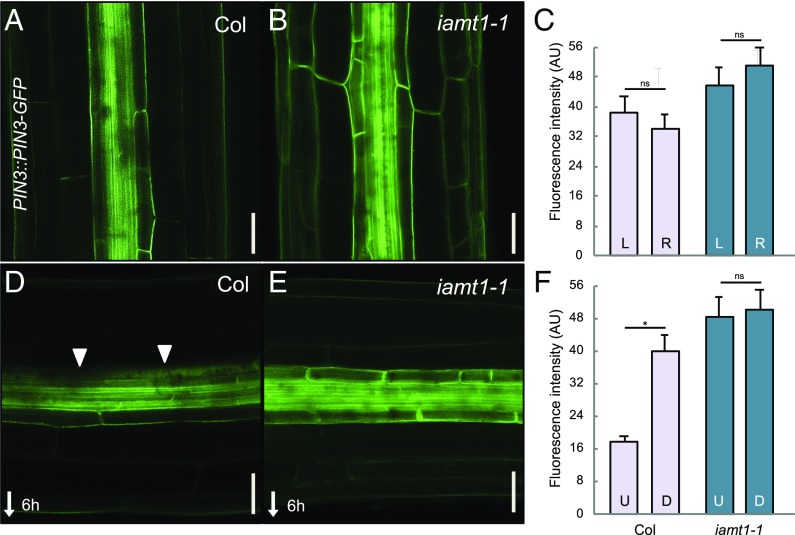
Fig. 4.
The iamt1-1 mutant shows defects in PIN3 lateralization after gravistimulation. (A and B) Localization of PIN3-GFP in 3-d-old etiolated WT (Col) and iamt1-1 hypocotyls. (C) Quantitative analysis of PIN3-GFP fluorescence in the left and right sections on the hypocotyls. The graph represents the average intensity of fluorescence of the outer and inner endodermal plasma membranes. (D and E) Localization of PIN3-GFP at 6 h after gravistimulation. (Scale bars: 50 μm.) (F) Quantitative analysis of PIN3-GFP in the upper and lower sections on the hypocotyls. Graphs represents the average intensity of fluorescence of endodermal plasma membranes facing away from the vasculature (left and right in vertical hypocotyls; upper and lower in horizontal hypocotyls). Arrows mark the lateralization of PIN3. Error bars represent SD. D, down; L, left; R; right; U, up. The asterisk indicates that the difference is statistically significant (Student’s t test, *P < 0.001).

