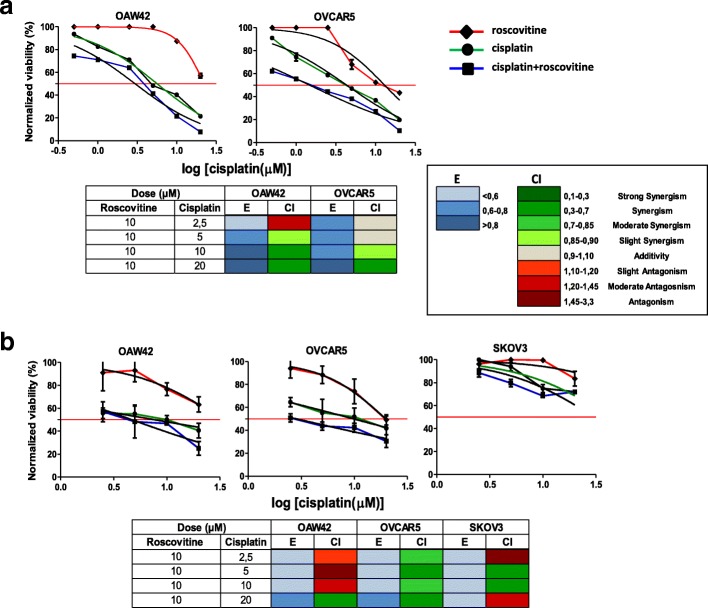
Fig. 4.
Cisplatin susceptibility in E-cadherin-expressing EOC cells is enhanced by combination with CDK5 inhibitor. a Dose-response curves of OAW42 and OVCAR5 cells treated with increasing concentration of roscovitine or cisplatin or alone (0.625, 1.25, 2.5, 5, 10, 20 μM) or in combination with 10 μM (the dose below the IC50 in these cells) roscovitine up to 96 h. The red line shows the dose-response curve to roscovitine alone. b Dose-response curves of OAW42, OVCAR5 and SKOV3 cells grown as MCA in Algimatrix™ treated treated as above. Cell viability was measured by CellTiter-Glo® Luminescent Cell viability assay. Tables below each panel: drug interaction analysis evaluated by the Chou and Talalay method. Effect and combination index are reported in the lower right panel A; color-coded fraction represents the effect values (E) and the combination index (CI) at the indicated drug combination doses

