
Figure 2.
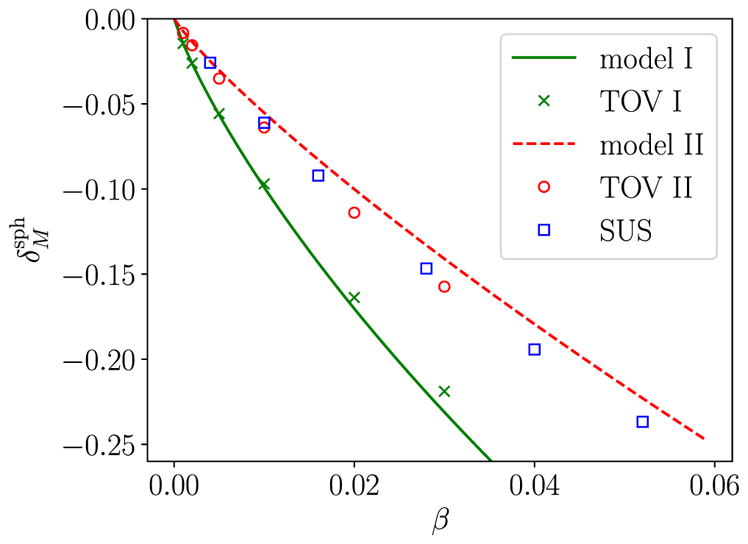
The relative change in the mass [see equation (36)] as a function of β for non-rotating SMSs according to Approaches I and II. Crosses and circles denote the numerical results from Section 3.1, while the solid and dashed lines represent the analytical, leading-order predictions (51) and (60) from Section 3.2. Note the non-linear behaviour of the analytical predictions, which are caused by the logarithmic terms in equations (51) and (60). The squares labelled SUS represent numerical results of SUS, who adopted Approach II.