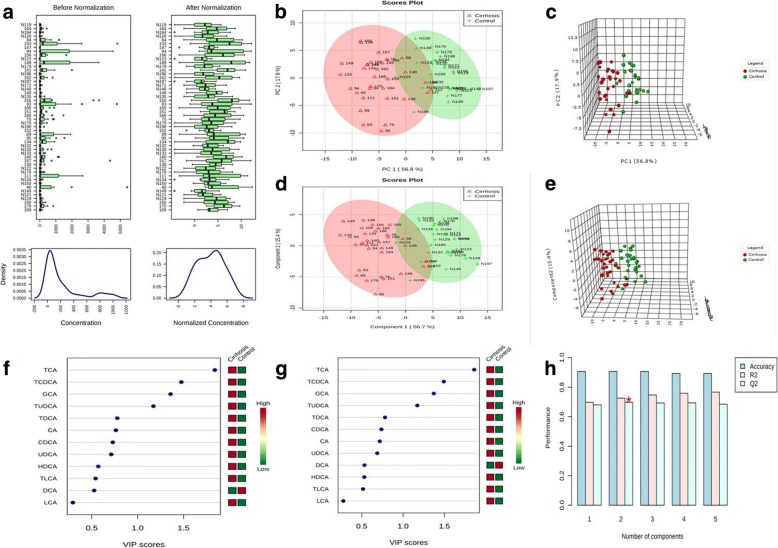
Fig. 1.
Normalization of original data, PCA and PLS-DA, importance in projection (VIP) analysis and cross validation of the optimal number of components of classification. a The appearance of characteristic graphical summary of data became bell-shaped distribution after a log transformation. b and c Both two dimension scores plot and three dimension scores plot of PCA indicated that there was a distinguished classification between the observation clustering of liver cirrhosis group and that of healthy control group. d and e Both two dimension scores plot and three dimension scores plot of PLS-DA indicated that there was a distinguished classification between the observation clustering of liver cirrhosis group and that of healthy control group. f and g VIP analysis of PLS-DA indicated that TCA was the most important metabolite in component one and component two. h Cross validation analysis indicated that two components model was the optimal model

