Fig. 2.
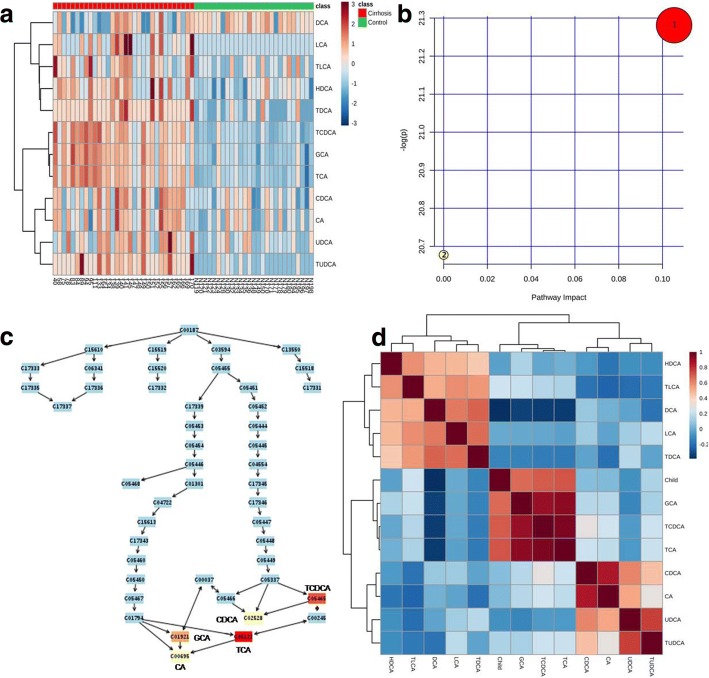
Heatmap analysis, summary of pathway effect, compound impact on pathway and Spearman correlation. a Heatmap analysis indicated that TCA, TCDCA, TUDCA, GCA, UDCA, CDCA, CA, TLCA, TDCA, HDCA and LCA were increased in liver cirrhosis as compared with healthy controls. b Pathway analysis showed that primary bile acid biosynthesis was increased in liver cirrhosis. 1: bile acid biosynthesis. 2: taurine and hypotaurine metabolism. c Compound impact analysis implied that TCA impacted most in the increased primary bile acid biosynthesis in liver cirrhosis. d Spearman correlation analysis indicated that concentrations of TCA, GCA and TCDCA were significantly positively correlated with Child-Pugh classification (P < 0.0001). And concentrations of LCA, HDCA, CDCA, UDCA, CA, TLCA, TDCA and TUDCA were not correlated with Child-Pugh classification (P > 0.05)

