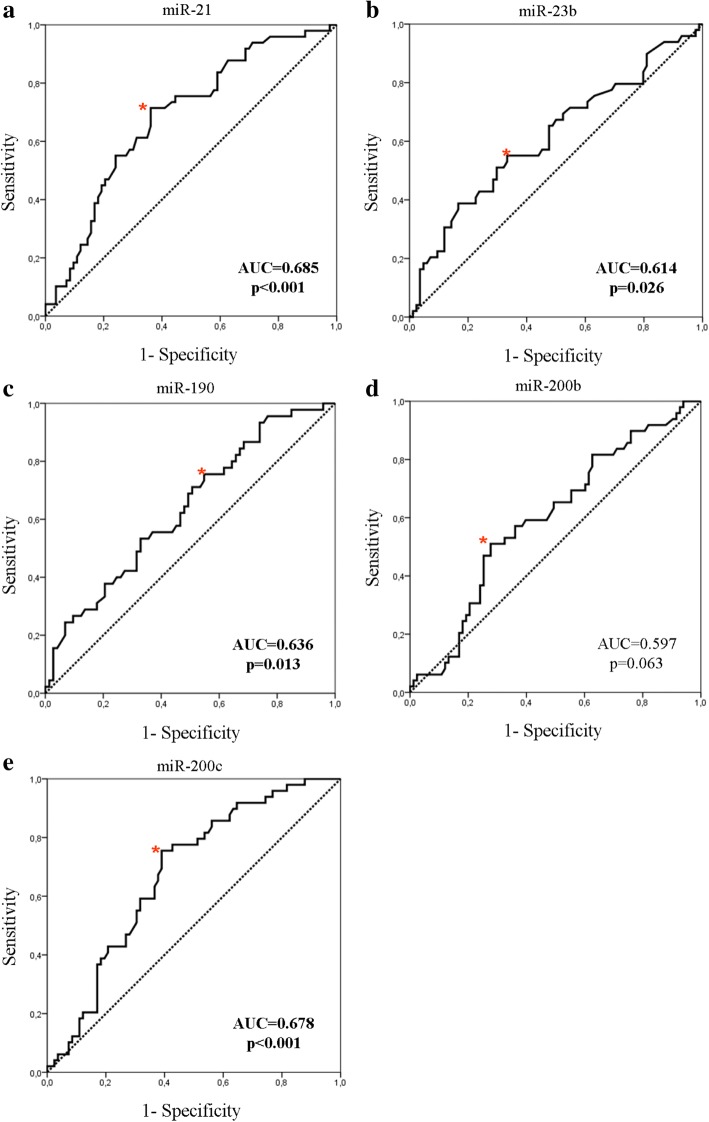
Fig. 7.
ROC curve analysis. Plasma miR-21 (a), miR-23 (b), miR-190 (c), miR-200b (d) and miR-200c (e) and their ability to discriminate between patients with relapse and those without relapse. Red asterisk indicates the highest Youden’s score index (sensitivity + specificity-1). AUC, area under the curve

