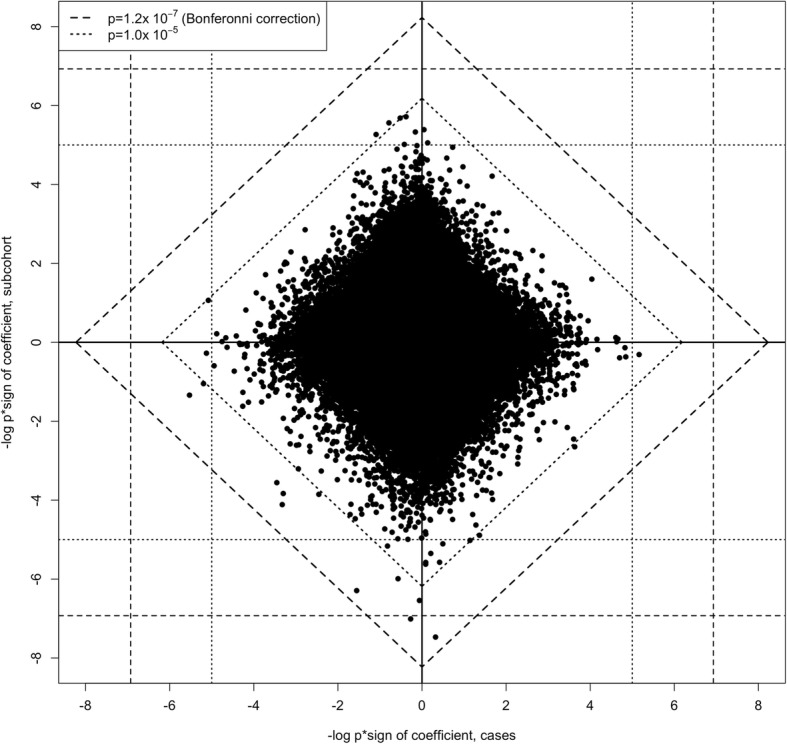
Fig. 3.

Diamond plot comparing –log10 p value × sign of coefficient for the estimated association between 25(OH)D and logit(methylation): subcohort (n = 1270, including 46 breast cancer cases) versus other breast cancer cases (n = 1024). The broken lines show critical values for single (vertical and horizontal grid lines) and Fisher’s combined (diagonal lines) p values, based on χ2 tests with 2 (for single) and 4 (for combined) degrees of freedom
