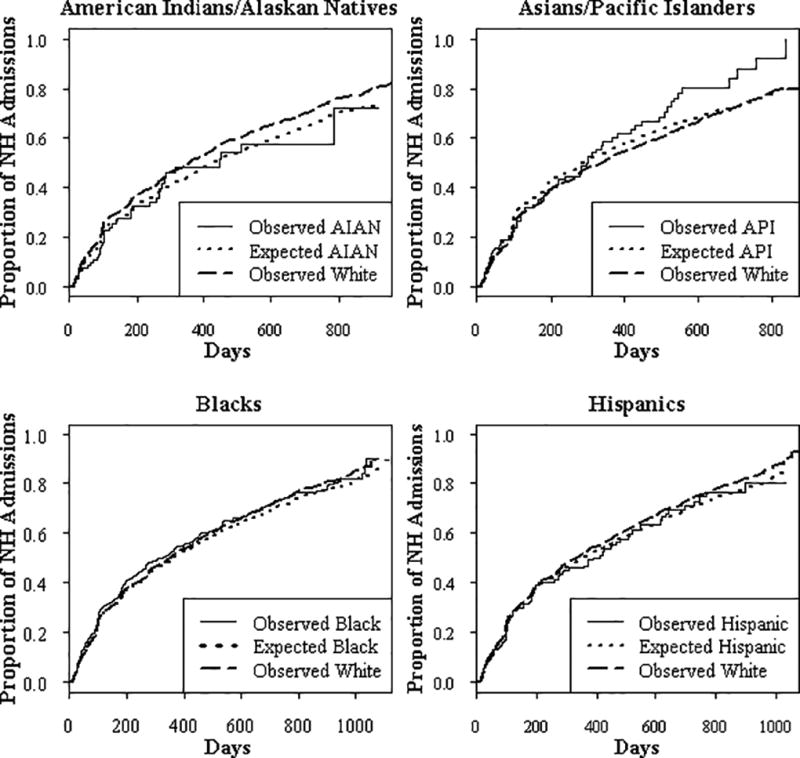
FIGURE 1.

Graphs show no racial or ethnic disparities in time to incontinence. Results are presented as observed and predicted proportions of admissions that developed incontinence over time. Compared to the proportion of each minority group of admissions that was expected to develop incontinence (signified by dotted line), the proportion of each minority group (solid line) observed to develop incontinence was not significantly different (p > .05 for each group). The proportion of White residents in the mixed race nursing homes observed to develop incontinence is also shown (dashed dotted line). Analyses adjusted for individual and nursing home/community predictors. Potential predictors included in the model of disparities in time to incontinence were age, gender, limitations in ADLs (Morris et al., 1999), cognitive deficits (MDS COGS) (Hartmaier et al., 1994), comorbidities (Charlson index; Charlson et al., 1987), indicators of vision problems, percentage of NH residents receiving Medicaid, index of deficiencies in NH quality of care, proportion of admissions that were White, proportion of the Census tract of the NH that was in an urban area or below poverty level, and the Census divisions in which NHs were located.
