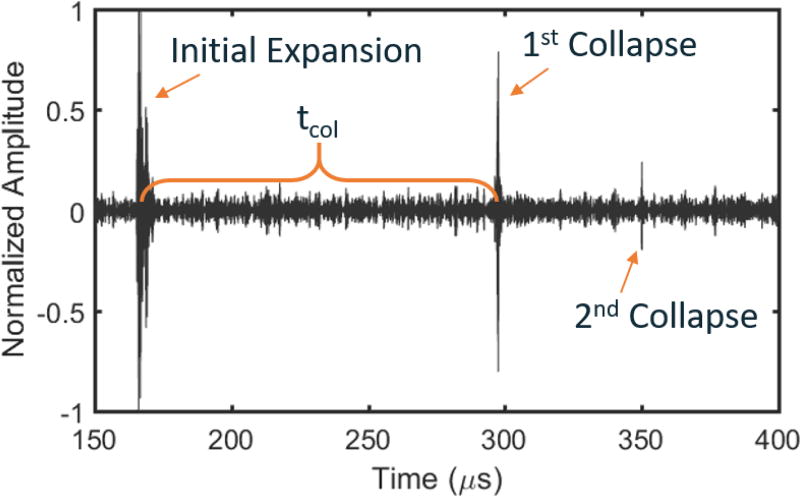
Figure 2.
Representative bubble cloud expansion and collapse signals acquired from hydrophone in an agar phantom after frequency-domain filtering using a Gaussian shaped filter with a 6 MHz center frequency and a Gaussian root-mean square width of 1 MHz. Time zero represents time at which the histotripsy array was fired. The tcol is calculated as the time between the peak expansion signal and the peak collapse signal. The initial expansion and first collapse signals were readily observable for all treatments of all phantoms and tissue samples.

