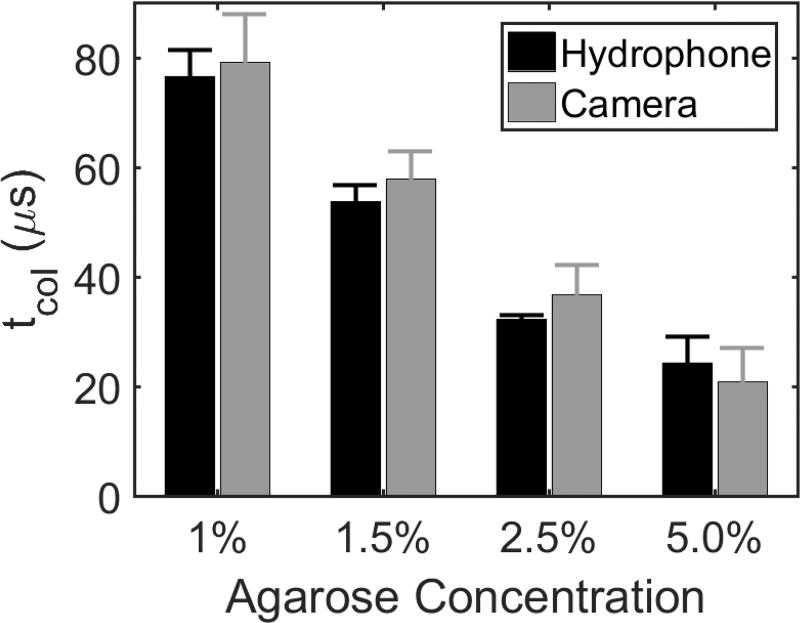
Figure 4.
Bubble cloud tcol in tissue-mimicking phantoms of varied agar concentration acquired from both hydrophone and high-speed camera. Results show tcol for the first histotripsy pulse in six replicate treatments of four different agar concentrations. A significant decrease in tcol with increasing agarose concentration was observed. All differences in tcol due to different agar concentrations were found to be statistically significant using Tukey’s HSD multiple comparisons test (p-values < 0.001) tcol measurements were not statistically significantly different between hydrophone and camera (p-value = 0.16).

