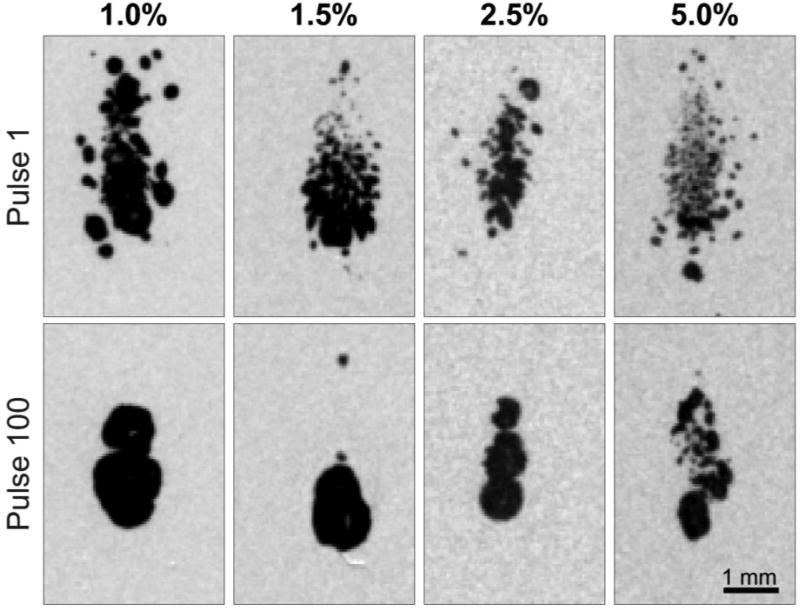
Figure 6.
High-speed imaging stills of maximum bubble expansion during first and last pulses of 100 pulse treatments of agar tissue phantoms of varying gel concentration. Maximum bubble expansions did not occur at the same time across agar concentrations and histotripsy dosages. At the time of Rmax, bubbles are smaller and more diffuse for higher agar concentrations and lower treatment dosages. Video format of this figure is available in online form.

