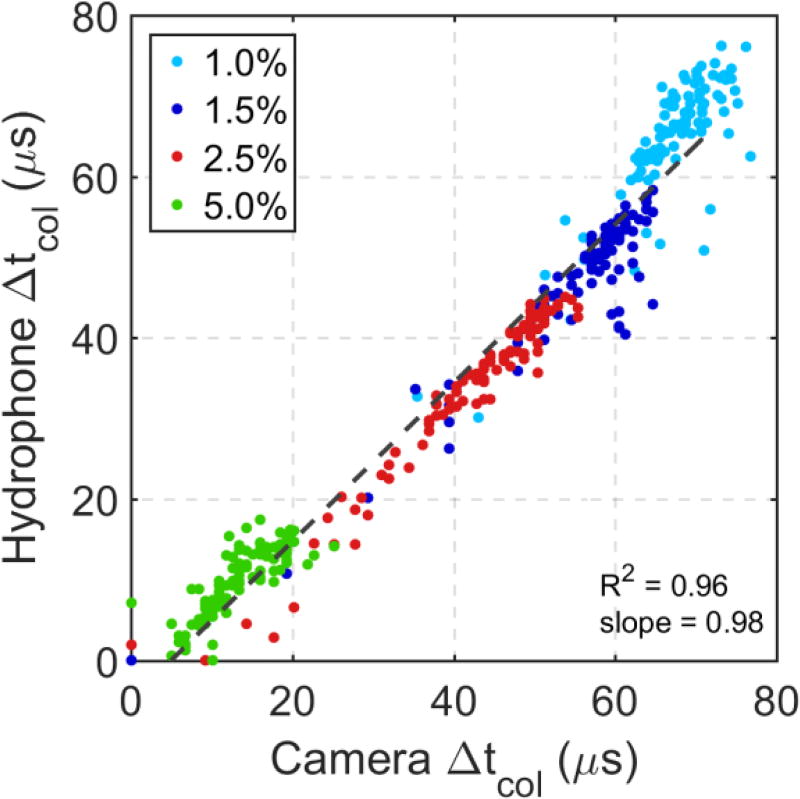
Figure 7.
Linear correlation between measurements of changes in collapse time tcol in agar gels of varying concentration acquired from hydrophone and high-speed imaging data (n=6). Dotted line represents best fit line calculated using linear regression. Δtcol calculated from both methods match well with each other. Data from different agar concentrations are easily segmented based on their differences in collapse time.

