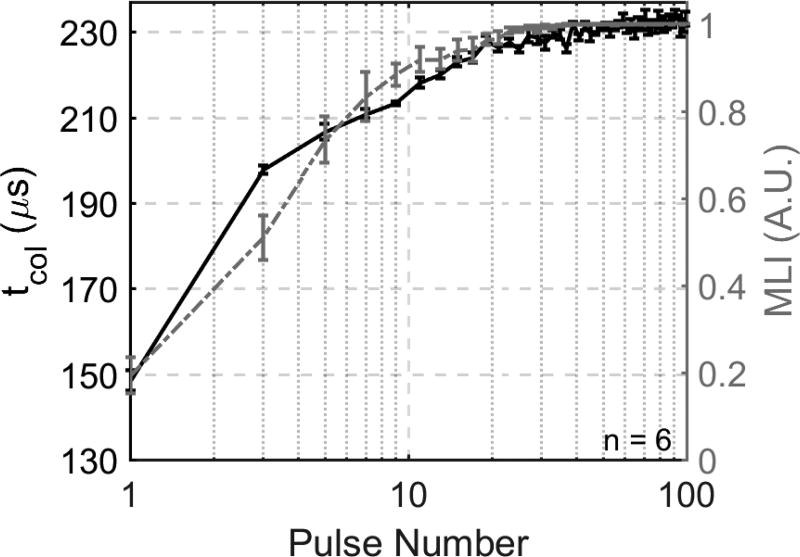
Figure 9.
tcol (left y-axis) and MLI (right y-axis) vs. pulse number throughout 100 pulses. The majority of changes in tcol and MLI occur early in treatment and at the same time. The change in tcol is greater than the change in MLI in the first several pulses, but both metrics even out quickly and reach a plateau threshold around 40 pulses.

