Figure 2.

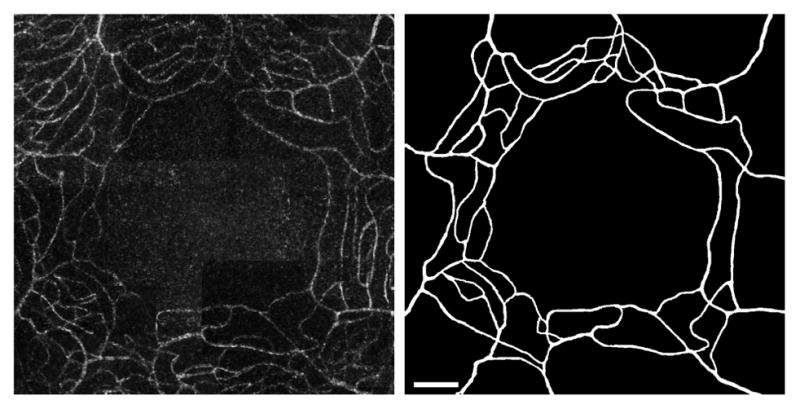
Diabetic group subject (mild NPDR). Left: central 5° × 5° of the parafoveal capillary network. Right: segmentation results from AOSLO image with the same field of view. Scale bar = 100μm.

Diabetic group subject (mild NPDR). Left: central 5° × 5° of the parafoveal capillary network. Right: segmentation results from AOSLO image with the same field of view. Scale bar = 100μm.