Figure 5.
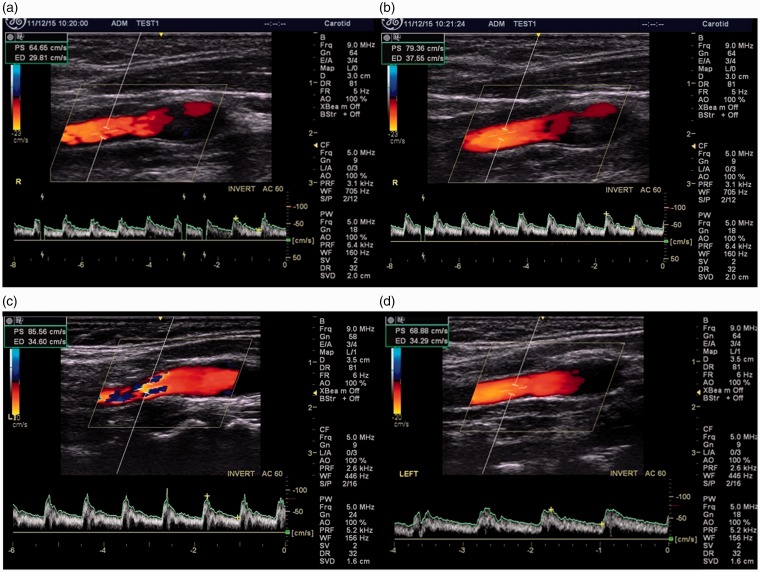
Images of the right internal carotid artery demonstrating physiological range of the PSV ((a) 65 cm/s and (b) 79 cm/s) measured by Scientist 4 1 minutes apart. Images of the left internal carotid artery demonstrating physiological range of the PSV ((c) 86 cm/s and (d) 69 cm/s) measured by Scientists 12 and 5 respectively.

