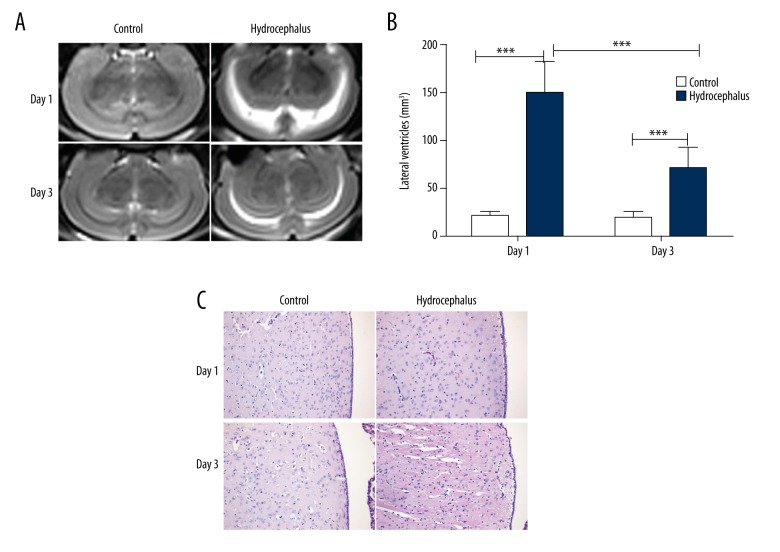
Figure 2.
Injection of autologous blood induced hydrocephalus. (A) Ventricles of rats in each group were observed using magnetic resonance imaging (n=6). (B) The lateral ventricular volumes of rats in each group were calculated. (C) The brain tissues of rats in each group were detected through hematoxylin-eosin staining (n=6). Typical images are presented. The results are presented as mean ± SD. *** p<0.001.

