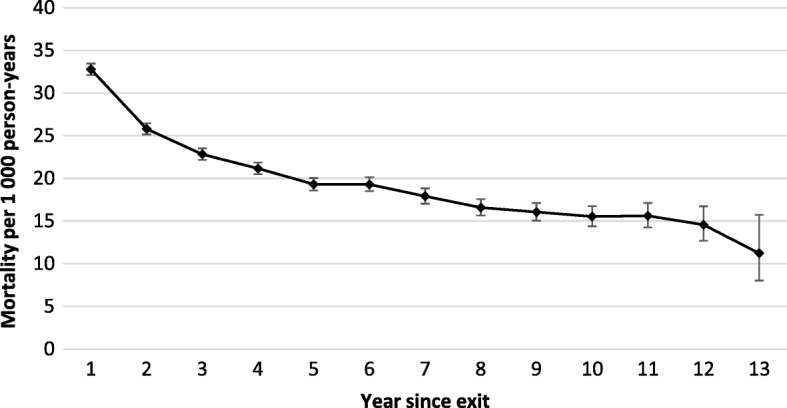
Fig. 1.

Crude mortality rate among South African miners by year since exit from the industry, 2001–2013 (n = 306,297). Each point on the curve represents the mortality rate over the preceding year, e.g. year 2 refers to the rate over the period 1.0–1.9 years after exit. Year 13 is an incomplete year. See Additional file 1: Table S1
