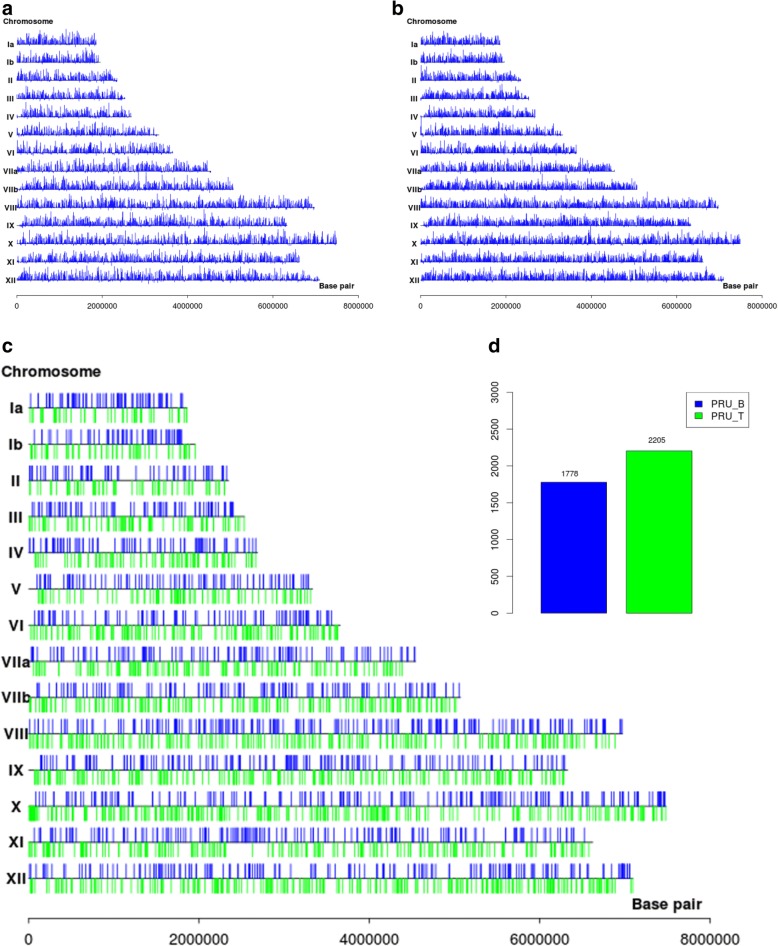
Fig. 1.
The mRNA expression across the chromosomal arm of T. gondii. The density of expressed genes across the chromosomal arm of tachyzoites (a) and bradyzoites (b). c The chromosome landscape of differentially expressed genes of T. gondii (fold change ≥ 2, P < 0.05). The differential gene expressions for T. gondii are indicated by the blue bar (bradyzoite upregulation) and green bar (tachyzoite upregulation). d The statistics of the differentially expressed genes of T. gondii

