Fig. 2.

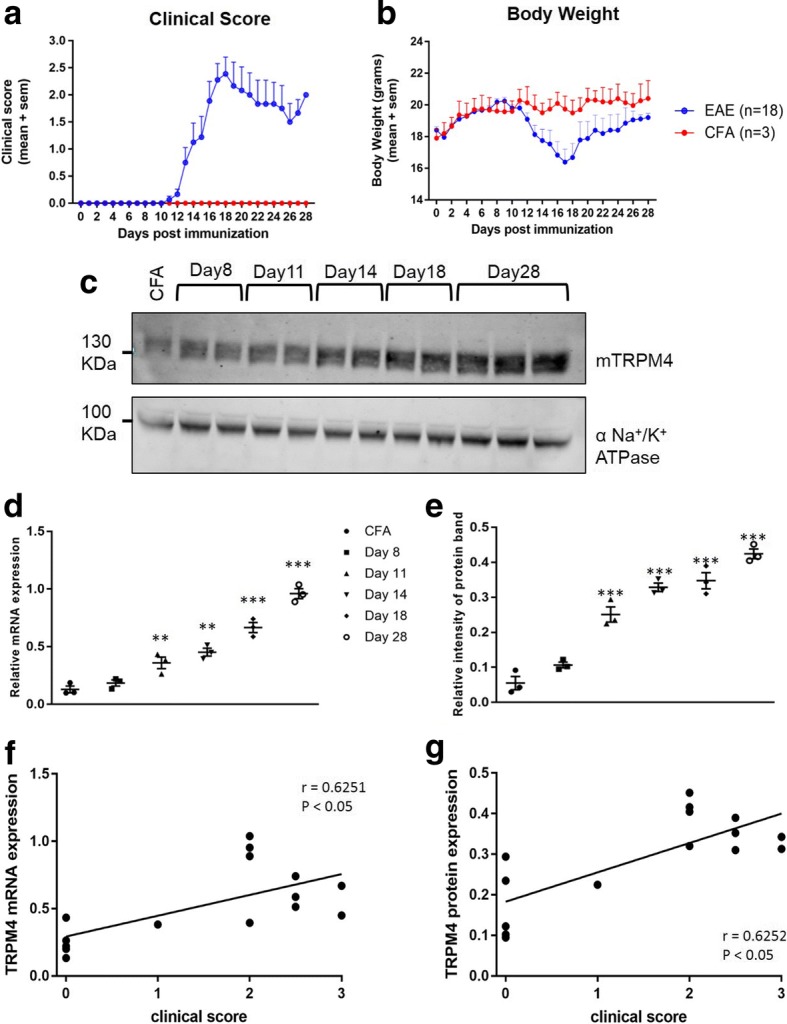
TRPM4 expression in spinal cords from EAE mice correlates with disease stages. Female C57BL/6 N WT mice were immunized with MOG35–55 peptide or with CFA only and sacrificed at different days post immunization reflecting different EAE stages. Clinical score and body weight are represented in panel a and b respectively. c and e TRPM4 protein expression at different EAE stages is shown as a relative intensity of protein band and alpha subunit of Na+/K+ ATPase is used as a loading control and for TRPM4 normalization. d qPCR analysis on Trpm4 gene expression in spinal cords from EAE mice and healthy control at different EAE stages. Data are represented as relative mRNA expression and the expression of Gapdh is used as reference. Data have been analyzed using one-way ANOVA with Sidak’s correction for multiple comparison test and are represented as mean ± s.e.m. (** P < 0.01; *** P < 0.001). Correlation between clinical score and TRPM4 mRNA (f) or TRPM4 protein expression (g) is calculated using Spearman’s correlation analysis. Spearman correlation coefficients (r) and their corresponding p values are shown
