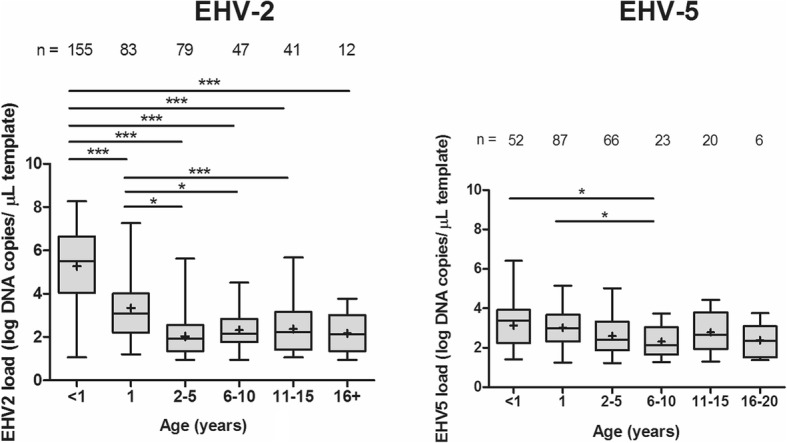
Fig. 2.

Viral DNA load of equid herpesvirus-2 (EHV-2) and EHV-5 in nasal swab samples collected from horses included in the study (n = 540) stratified by age. The middle line in each box represents median, whiskers represent minimum and maximum values, with means indicated by ‘+’. Significance levels calculated using Kruskal-Wallis test with Dunn’s multiple comparison are indicated by the stars: < 0.05 (*),< 0.001 (***). The number of horses in each category is indicated above each box
