FIGURE 6.
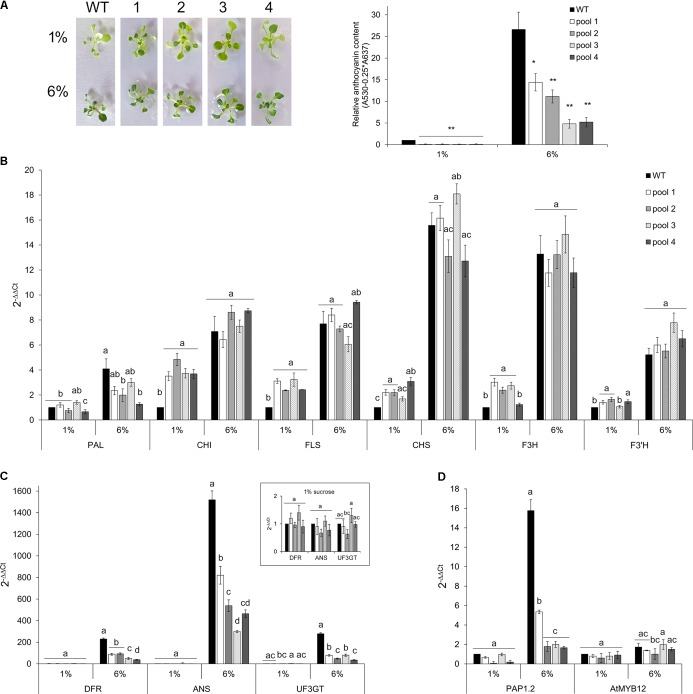
Anthocyanin content and qRT-PCR analysis in Arabidopsis seedlings grown on control and anthocyanin inductive medium. (A) Left panel: 20-days-old Arabidopsis wild type (WT) and CcMYB12 seedlings (1, 2, 3, and 4) grown in MS medium supplemented with 1 or 6% sucrose under long day condition. Right panel: Anthocyanin content in 2-weeks-old WT and CcMYB12 seedlings grown in 1 and 6% sucrose. Values are reported as relative to WT 1% sucrose, set as 1. Data represent mean values (+SD, n = 3). Within each growth condition, asterisks ∗ and ∗∗ indicate statistically significant differences (P < 0.05 and P < 0.01 respectively), between the means for WT and tested transgenic samples according to Student’s t-test. (B–D) qRT-PCR analysis of early (B) and late (C) flavonoid biosynthetic genes, and AtPAP1 and AtMYB12 TFs (D) in seedlings grown in 1 and 6% sucrose. Upper panel in (C) represents late biosynthetic genes with a low expression level in 1% sucrose condition, with the appropriate axis scale. Actin was employed as reference gene. WT grown in 1% sucrose is the calibrator. Values are means ± SD of three biological replicates. Bars with different letters are statistically different to each other according to one-way ANOVA Tukey test (p < 0.05).

