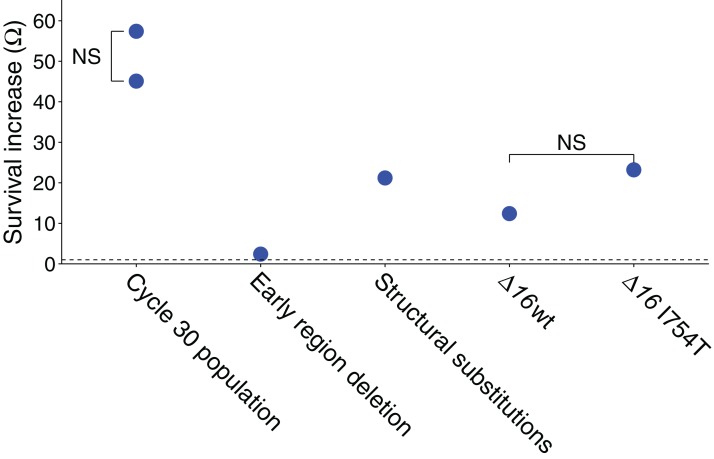
Figure 1. Ω values represent the survival advantage of the phage indicated over wild-type.
All illustrated values are explained in the text, and the statistics of all values are also given in the text (each value shown is significantly greater than 1.0 by at least P ≤ 0.001). ‘NS’ indicates the absence of a statistically significant difference between the two samples compared. The dashed line represents Ω = 1, the value at which the two phages have equal survivals. The ‘early region deletion’ and ‘structural substitutions’ separately test the cycle-30-evolved 2.1 kb deletion from the three substitutions evolved in genes 16 and 17. The two Δ16 columns are from the test in Table 2.

