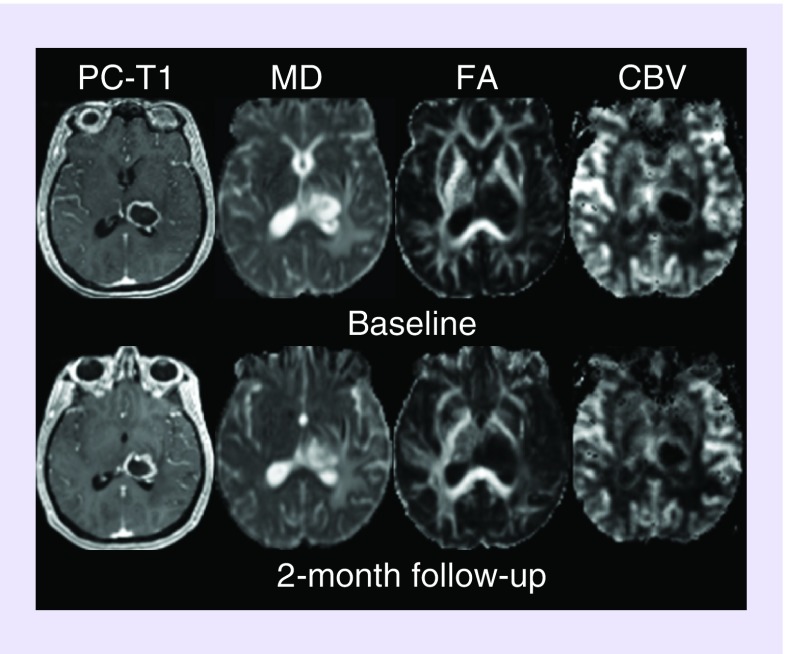
Figure 2. . Axial co-registered contrast-enhanced T1-weighted image, and corresponding mean diffusivity, fractional anisotropy, cerebral blood volume and choline/creatine maps are shown at baseline and at a 2-month follow-up period.
CBV: Cerebral blood volume; FA: Fractional anisotropy; MD: Mean diffusivity.

