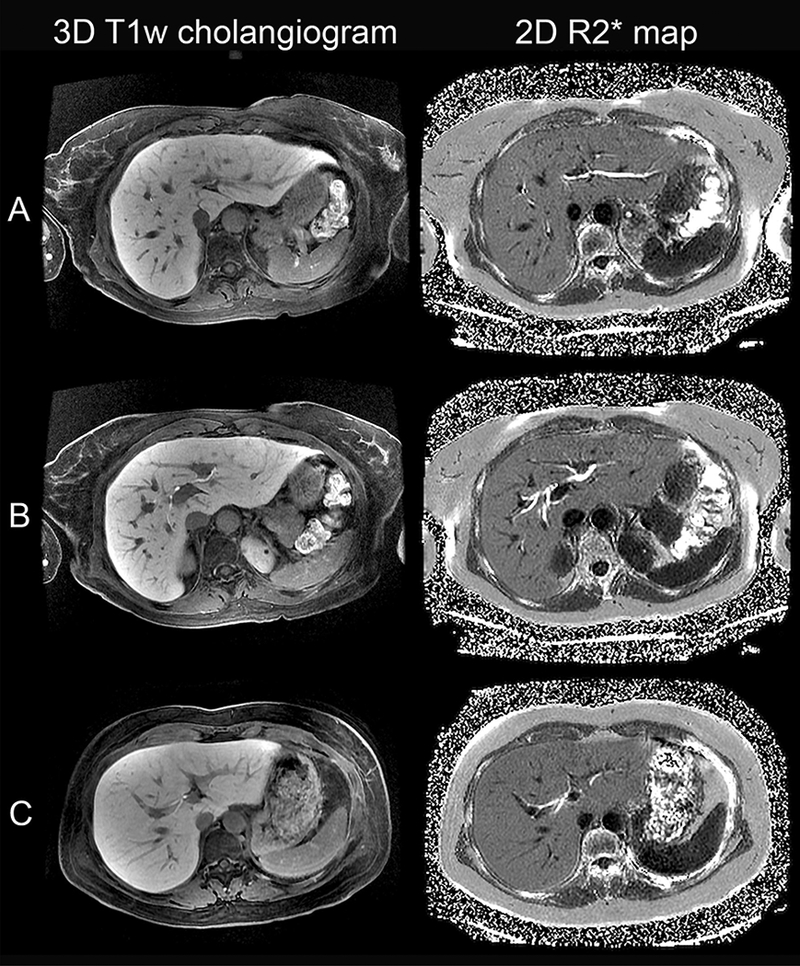
Fig. 1.

3D T1w cholangiograms and 2D R2* maps of three living liver donors demonstrating A segment 2 duct in a 57-year-old female, B segment 4, right anterior, and right posterior ducts in a 56-year-old female, and C right anterior and segment 3 ducts in a 36-year-old female. Note the more complete visualization of second-order bile ducts on R2* maps compared to Gd-EOB-DTPA-enhanced 3D T1w MRC.
