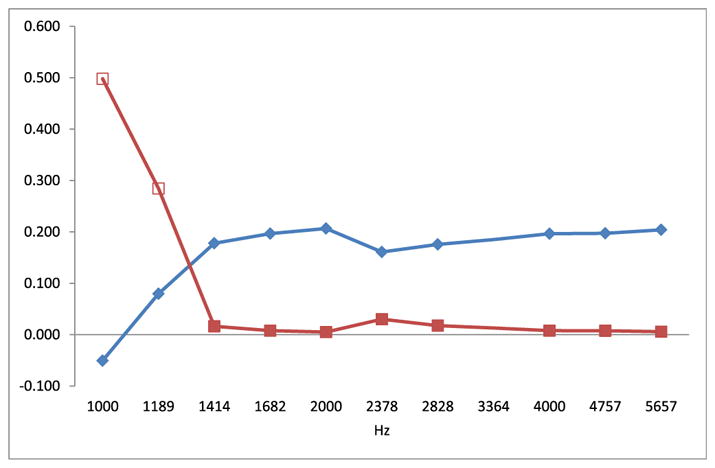
Fig. 2.

Spearman correlation of amplitudes of DPOAEs at 11 default frequencies for left ears of all children against cord serum PCB 153 concentration. On the vertical axis were plotted parameters of Spearman correlation ρ (red squares) and its p value (blue diamonds). Full squares denote statistical significance at p < 0.05. (For interpretation of the references to colour in this figure legend, the reader is referred to the web version of this article.)
