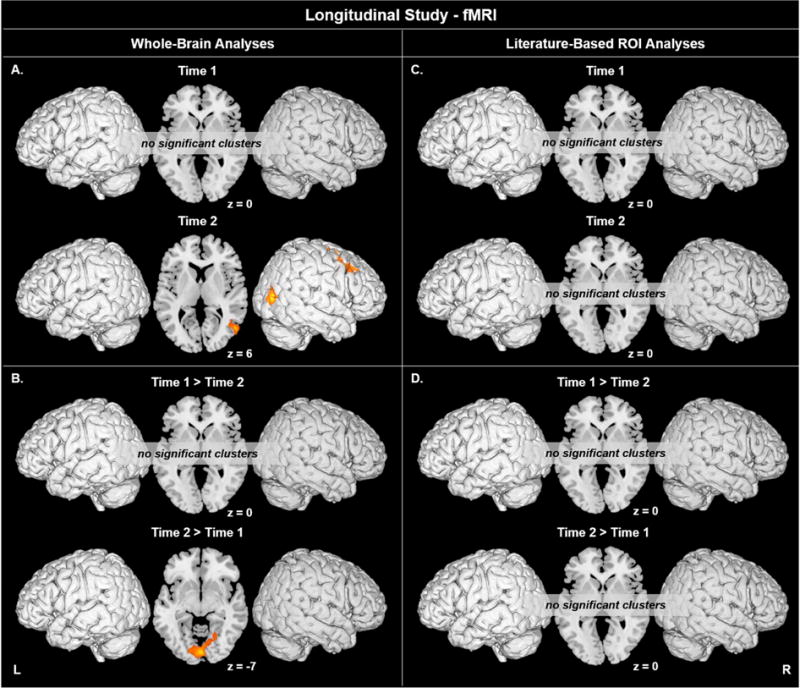
Figure 3.

A-B) Coherent visual motion-evoked activation at A) T1 and T2, and for B) T1 versus T2 across the whole brain. C-D) Coherent visual motion-evoked activation within V5/MT at C) T1 and T2, and for D) T1 versus T2, using ROIs centered on literature-based coordinates. Motion > Static, voxel p < 0.005 uncorrected, cluster p < 0.05 corrected. Activation up to 5 mm beneath the cortical surface is displayed.
