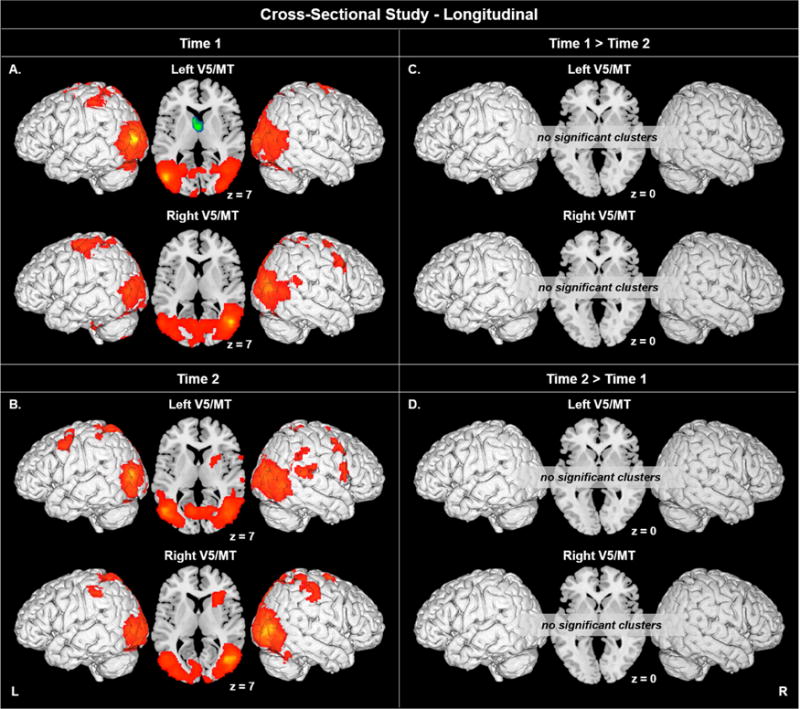
Figure 4.

Bilateral V5/MT seed-to-voxel results for A) T1, B) T2, C) T1 > T2, and D) T2 > T1. Areas exhibiting positive correlations are indicated in orange/red, areas exhibiting negative correlations are indicated in green/blue. Voxel p < 0.005 uncorrected, cluster p < 0.05 corrected. Connectivity up to 5 mm beneath the cortical surface is displayed.
