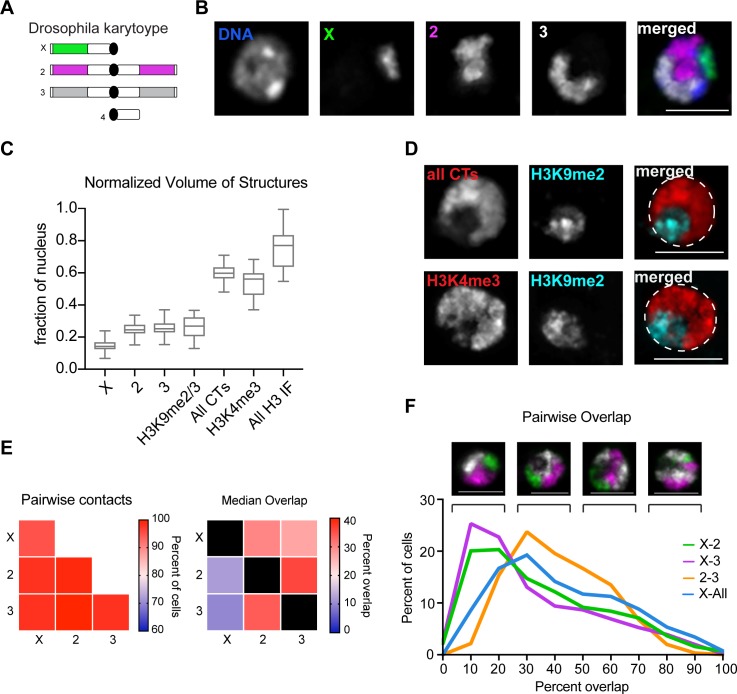
Fig 1. Drosophila Kc167 cells form robust CTs.
(A) Schematic representation of D. melanogaster karyotype. The unlabeled heterochromatin is depicted in white, while euchromatin is depicted in green (X-chromosome), pink (chromosome 2), and gray (chromosome 3). (B) Representative Kc167 cell nucleus with Oligopaints labeling chromosomes X (green), 2 (pink), and 3 (gray). Total DNA (Hoechst stain) is shown in blue. Scale bar equals 5 μm. (C) Tukey box plot showing structure volume as a fraction of nuclear volume. X-axis denotes the structure being measured. (D) Top: Representative nucleus of IF/FISH in Kc167 cells with Oligopaints labeling chromosomes X, 2, and 3 all in red (all CTs), and anti-H3K9me2 IF in cyan. Bottom: IF to euchromatin (H3K4me3) in red and heterochromatin (H3K9me2) in cyan. Scale bar equals 5 μm. (E) Left: Heatmap of pairwise contact frequencies for a population of n>500 Kc167 cells. The diagonal boxes are whole-chromosome pairing frequencies. Right: Heatmap of median CT overlap for a population of n>500 Kc167 cells. Overlap is shown as a percentage of CT volume. Values in the bottom half of the heatmap are normalized to the structures listed along the bottom, while the top half are normalized to the structures listed on the left. (F) Top: Representative images of Kc167 cells with whole chromosome Oligopaints, showing the varying degrees of CT intermixing found in the population. Scale bar equals 5 μm. Bottom: histogram showing CT overlap as a percent of CT volume. Overlap between chromosomes X and 2, and X and 3, are shown as a percent of chromosome X CT volume. Overlap between chromosomes 2 and 3 is shown as a percent of chromosome 2 CT volume.

