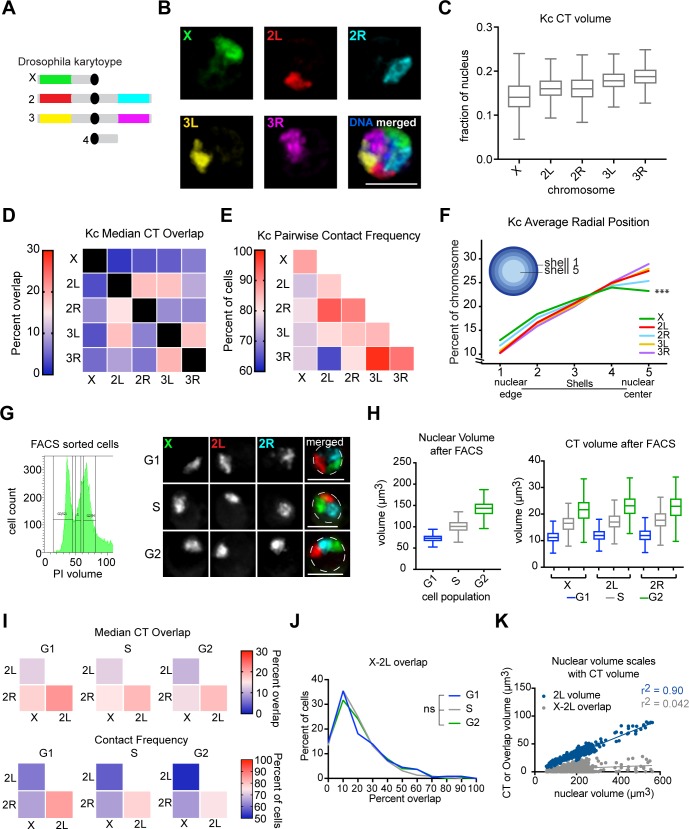
Fig 2. Chromosome arms form independent territories.
(A) Schematic of chromosome arm-specific Oligopaints. (B) Representative Kc167 cell nucleus with Oligopaints labeling chromosomes X (green), 2L (red), 2R (cyan), 3L (yellow), and 3R (magenta). Total DNA (Hoechst stain) is shown in blue. Scale bar equals 5 μm. (C) Tukey box plot showing CT volumes as a fraction of nuclear volume. n>500 cells. (D) Heatmap showing median CT overlap for a population of n>500 Kc167 cells, where overlap is shown as a percentage of CT volume. Values in the bottom half of the heatmap are normalized to the structures listed along the bottom, while the top half are normalized to the structures listed on the left. (E) Heatmap showing pairwise contact frequencies for a population of n>500 Kc167 cells. The diagonal boxes represent whole-chromosome pairing frequencies. (F) Radial position of chromosomes in the nucleus determined by shell analysis with five shells of equal volume, where shell 1 is the closest to the nuclear periphery and shell 5 is the nuclear center. n>500 cells. ***p<0.0001, Mann-Whitney test. (G) Left: plot of DNA content in Kc167 cells after FACS. Right: Representative nuclei after FACS with Oligopaints labeling chromosomes X (green), 2L (red), and 2R (cyan). Dashed lines represent nuclear edge. Scale bar equals 5 μm. (H) Left: Tukey box plot showing nuclear volumes of G1, S, and G2 phased cells after FACS sorting, determined by Hoechst stain. Right: Tukey box plot showing CT volumes after FACS sorting. The data shown represent one technical replicate (n = 220–350 cells per cell cycle phase). These data were confirmed by two additional technical replicates. (I) Top: heatmaps showing median CT overlap for a population of n>200 FACS sorted Kc167 cells, where overlap is shown as a percentage of the structures listed along the bottom. Bottom: heatmaps showing pairwise contact frequencies for a population of n>200 FACS sorted Kc167 cells. (J) Histogram showing X-2L CT overlap as a percent of X CT volume after FACS. Binned data from a single technical replicate are shown (n>200 cells). These results were confirmed by at two additional technical replicates. (K) Scatter plot of nuclear volume (X-axis) versus 2L CT volume or X-2L overlap volume (Y-axis). Chromosome 2L volume data are shown in blue, while X-2L overlap data are shown in gray. n = 835 cells.

