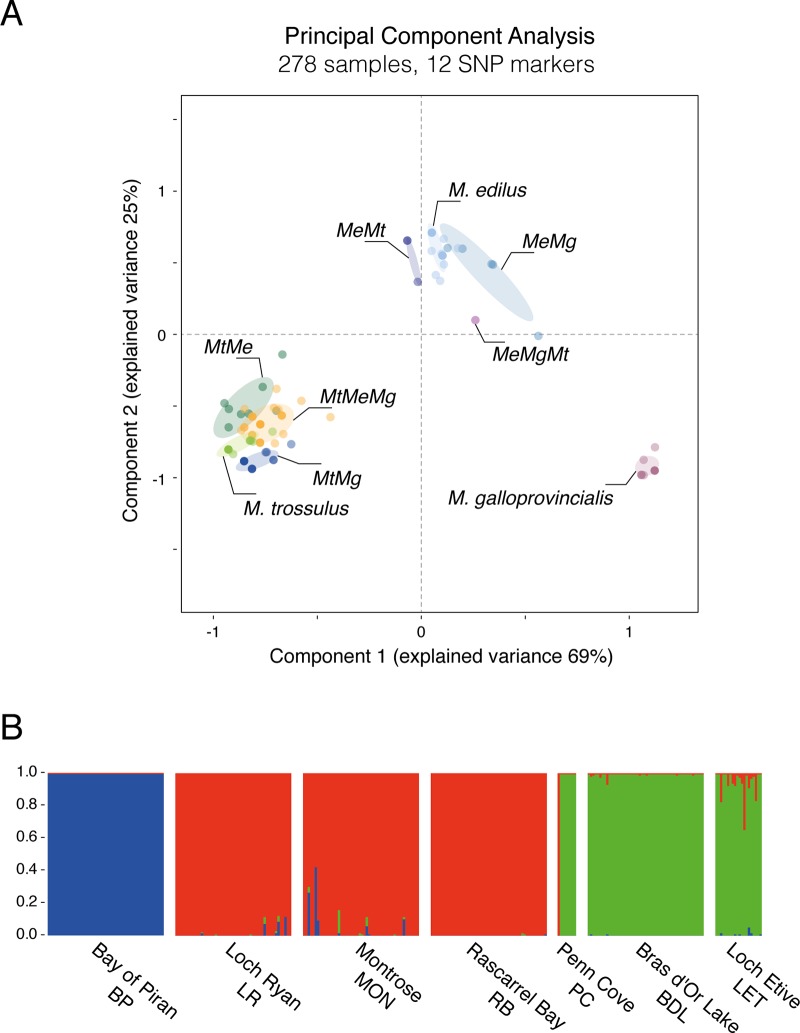
Fig 2. Multilocus genotyping across 12 SNP makers.
(A) Principal Component Analysis of the 12 diagnostic markers across the 278 samples. The Genotype classes are clustered and annotated on the figure. (B) Structure plots constructed using the Admixture Ancestry Model with independent allele frequencies per population (K = 3, burnin = 10,000, reps = 100,000), showing the genetic composition of reference and validation population.

