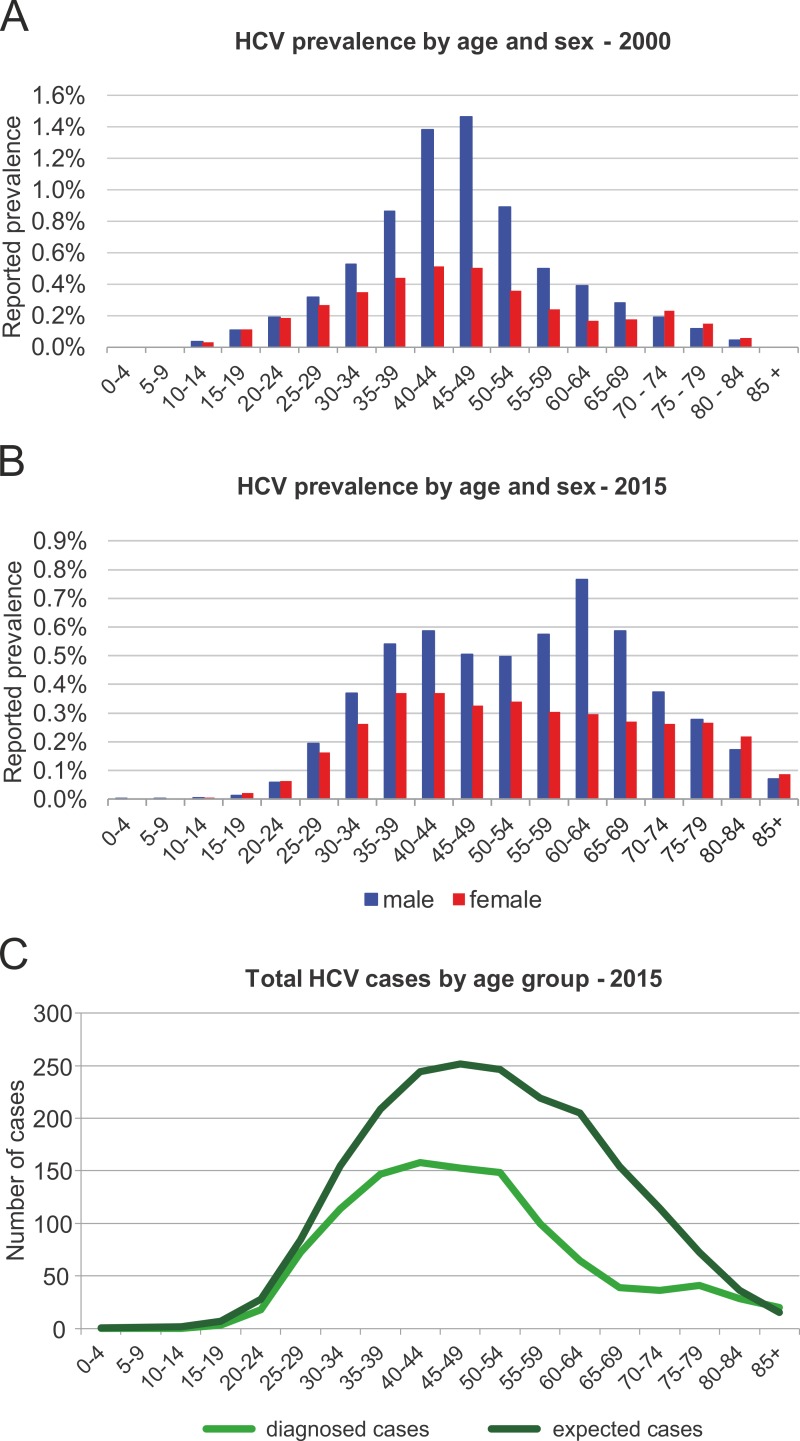
Fig 1.
Age and gender distribution of chronic HCV infections in Tyrol for (A) 2000 and (B) 2015 based on previously reported data.[2] Prevalence estimates for 2015 are based on diagnosed cases and were adjusted for deaths and cures. (C) Comparison of expected and observed total HCV cases grouped by age in Tyrol.

