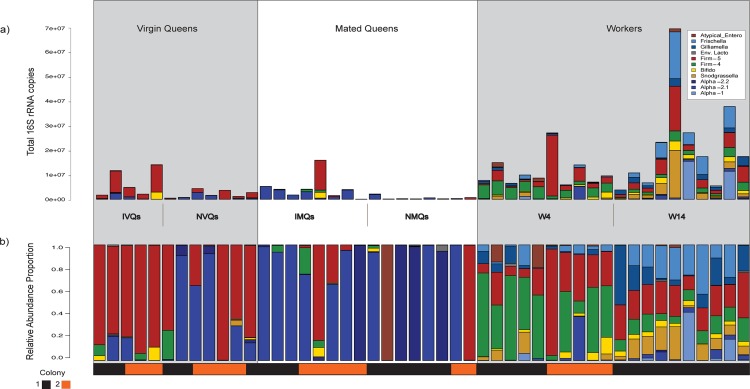
Fig 3. Bar plots of absolute and relative abundance of bacterial taxa per sample.
a) Absolute abundance of bacterial species in queen samples subdivided by mating and isolation state and by colony of origin. The bar plots were made by multiplying the total number of 16S rRNA copies by the relative abundance proportions, and then dividing taxon-specific groups by the number of 16S rRNA operons observed in corresponding complete genomes. b) Relative abundance of bacterial species in samples subdivided by mating and isolation state and by colony of origin.

