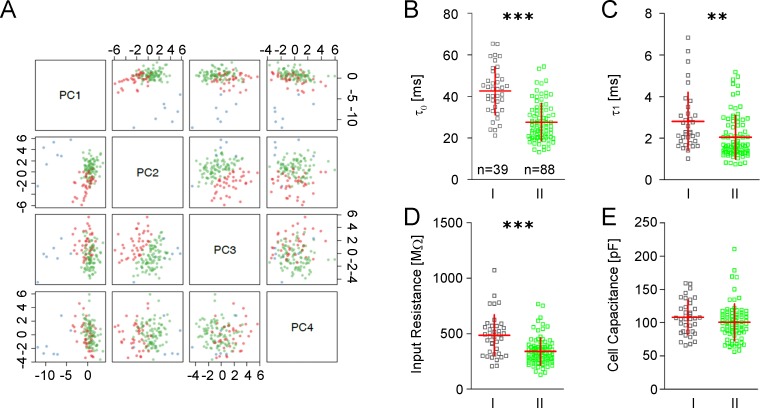
Fig 1. Principal component analysis and passive membrane properties in GIN.
A Principal component analysis of 31 electrophysiological and 18 morphological parameters derived from 127 GIN (red and green dots) and 6 pyramidal cells (blue dots). Principal components PC1-PC4 are plotted pairwise. Red dots indicate group I GIN, green dots group II GIN. B-E Scatter plots of passive membrane properties of both GIN subgroups (horizontal red bar: mean value, vertical red bar: SD). B Somatic (τ0) and C dendritic (τ1) time constants; D input resistance (RN) and E cell capacitance (CN).

