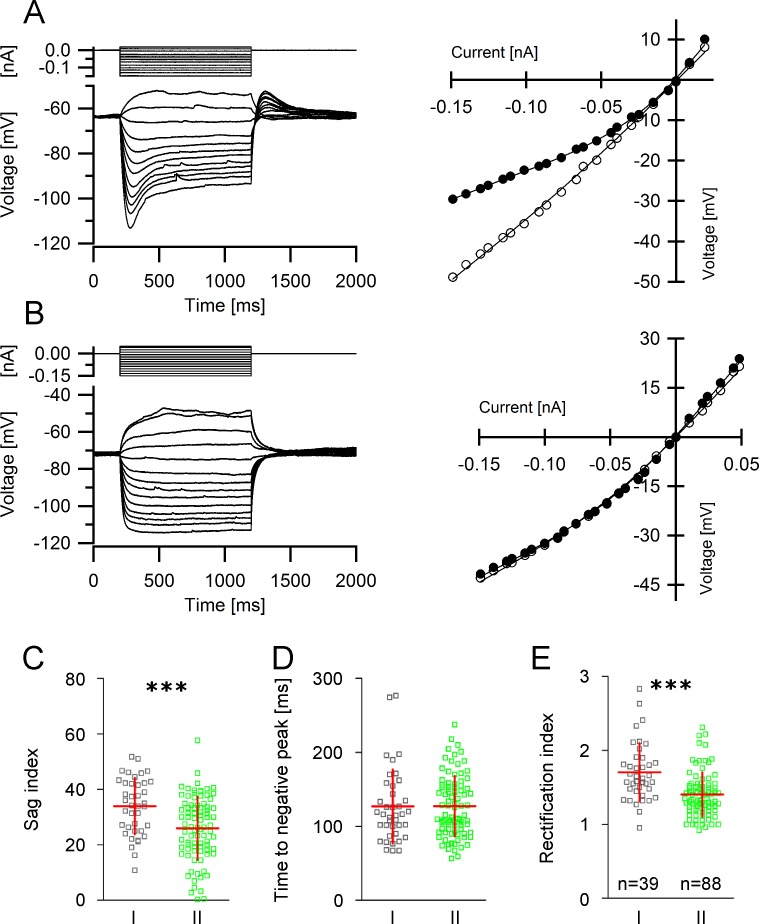
Fig 2. Current-voltage relationship in GIN.
A, B Left panels Determination of the current-voltage-curve in GIN. A series of de- and hyperpolarizing current steps (upper traces) were injected into the cells and the corresponding voltage responses (lower traces) were measured. The subsequently obtained recordings are shown superimposed. Note the large sag potential in A. Right panels Corresponding I-V curves derived from the recordings shown in A and B. Closed circles depict the IV-relationship at steady state (i.e. at the end of the current pulse) and open circles show the IV-relationship at the time point of occurrence of the maximum negative peak potential. The difference between these two curves corresponds to the sag potential. C-E Differences in the IV-relationship in group I and group II GIN. Scatter plots of sag index (C), time to negative peak (D) and rectification index (E) in both GIN subgroups.

