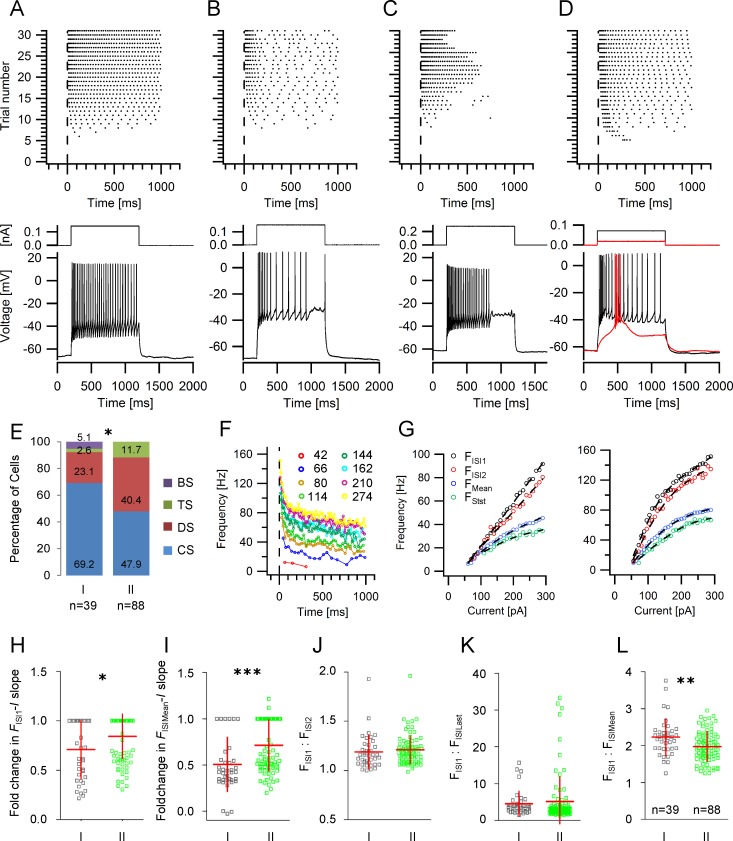
Fig 4. Action potential discharge properties in GIN.
A-D Firing patterns in GIN. Upper panels: Representative raster plots of the different action potential discharge patterns in GIN. Each dot represents an action potential and each row of dots represents the response to a rectangular depolarizing current pulse (1 s). The current strengths increased from bottom to top. Lower panels: examples for spike trains evoked by medium current strengths from the raster plots above. A continuous spiking (CS), B discontinuous spiking (DS), C transient spiking (TS), D burst spiking (BS). E -Relative proportion of the different discharge patterns within the various GIN groups. F Representative frequency-time (F-t) relationship obtained from a continuously firing GIN. Current intensities are indicated. G Representative frequency-current (F-I) plots observed in GIN. Each diagram shows the F-I relationship for the first (black circles) and the second ISI (red circles), the steady state (last 300 ms, green circles) and the mean frequency (blue circles). Some GIN displayed a linear F-I relationship (left panel), while others exhibited a non-linear F-I relationship at the initial frequency (FISI1, right panel). H, I Scatter plots displaying the relative change of the FISI1-I (H) and FISIMean-I (I) slopes. J Scatter plot of the ratio of the frequencies of the first and the second ISI in group I and II GIN. K Scatter plot of the ratio of the frequencies of the first and the last ISI in group I and II GIN. L Scatter plot of the ratio of the frequencies of the first and the mean frequency in group I and II GIN.

