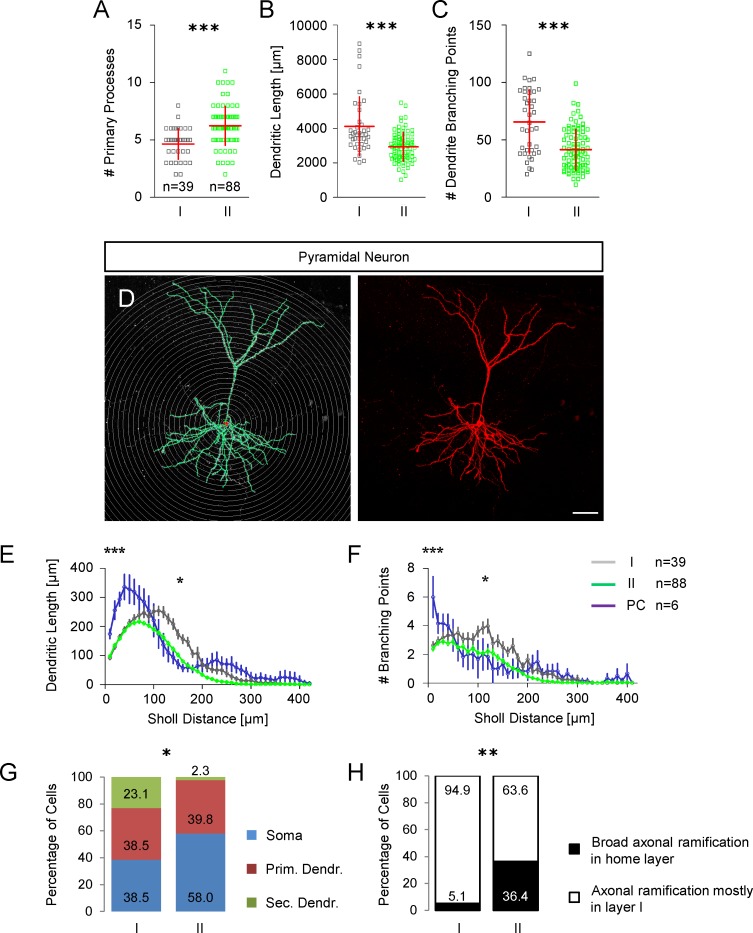
Fig 10. Morphological characterization of GIN in the cingulate cortex.
A Scatter plot showing the number of primary processes in group I and group II GIN. B Scatter plot showing the total dendritic length in group I and group II GIN. C Scatter plot showing the total number of dendrite branching points in group I and group II GIN. D Representative morphology of a biocytin-injected pyramidal cell in the mouse cingulate cortex. Sholl sphere intervals: 10 μm; scalebar: 50 μm. Digital reconstruction in the left panel; maximum intensity projection of confocal Z-stack images of the corresponding pyramidal cell in the right panel. E Sholl analysis of dendrite length in group I (grey) and group II (green) GIN compared to pyramidal neurons (blue). The dendritic length is plotted as a function of the Sholl distance (mean ± SEM). Compared to GIN, we found a greater dendritic length in pyramidal neurons (two-way analysis of variance). Group I GIN vs. pyramidal neurons: 10 μm p<0.05; 20–50 μm p<0.001; 60 μm p<0.01; 110 μm p<0.05; 120–160 μm p<0.001; 170 μm p<0.01. Group II GIN vs. pyramidal neurons: 10 μm p<0.05; 20–60 μm p<0.001; 70 μm p<0.01; 80 μm p<0.05; 230 μm p<0.05. Group I GIN exhibited a greater dendritic complexity compared to group II GIN: 80 μm p<0.05; 100–190 μm p<0.001; 200–220 p<0.05; 230–240 μm p<0.01. F Branching points plotted as a function of the Sholl distance (mean ± SEM). Group I GIN vs. pyramidal neurons: 10 μm p<0.001; 120 μm p<0.05. Group II GIN vs. pyramidal neurons: 10 μm p<0.001. Group I GIN exhibited a greater dendritic complexity compared to Group II GIN: 60 μm p<0.01; 100–120 μm p<0.001; 140 μm p<0.001; 150–160 p<0.05; 170 p<0.001; 200 μm p<0.001; two-way analysis of variance. G Bar chart showing the relative percentages of different axon origins in both GIN subgroups. H Bar chart showing the relative percentages of axonal ramifications in the GIN home layer; comparison of group I vs. group II GIN.

