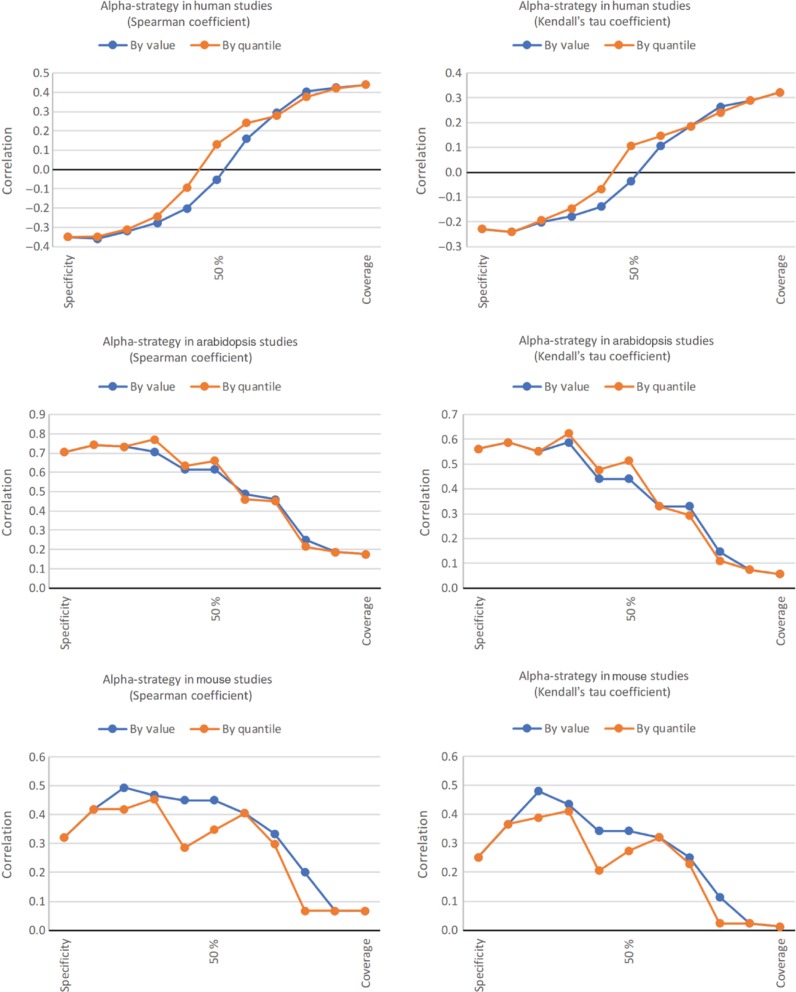
Figure 7:
Correlation between the manual rankings and the automatic ones. This figure includes the results for the Homo sapiens rankings (top), the Arabidopsis thaliana rankings (middle), and the Mus musculus rankings (bottom). On the left, we illustrate the Spearman’s ρ correlation coefficient; on the right the Kendall’s τ coefficient. On each graph, the α value runs from 0.0 to 1.0 in steps of 0.1, where 0.0 corresponds to a ranking based solely on the Specificity measure, and 1.0 corresponds to a ranking based solely on the Coverage measure. The midpoint is labelled 50 %.

