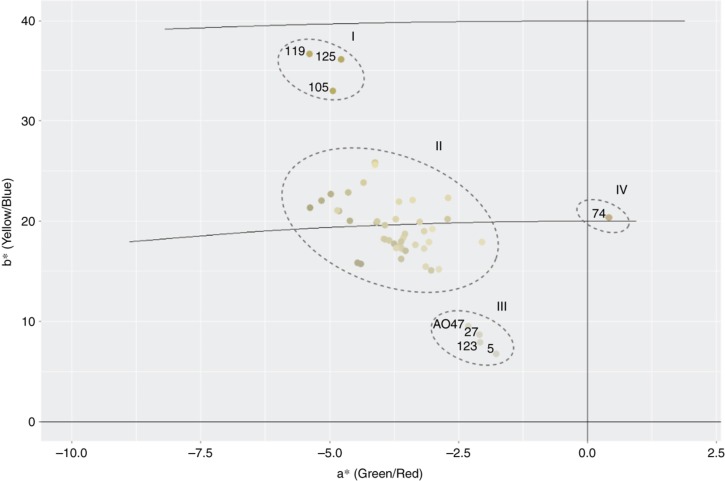
Figure 6:
Location of the cassava samples in the CIELAB color space according to their root pulp colors. The a* value characterizes the coloration in the regions of red (+a*) to green (-a*). The value b* indicates coloring in the range of yellow (+b*) to blue (-b*). Sample identifiers in ellipse II were omitted for easier interpretation of the plot.

