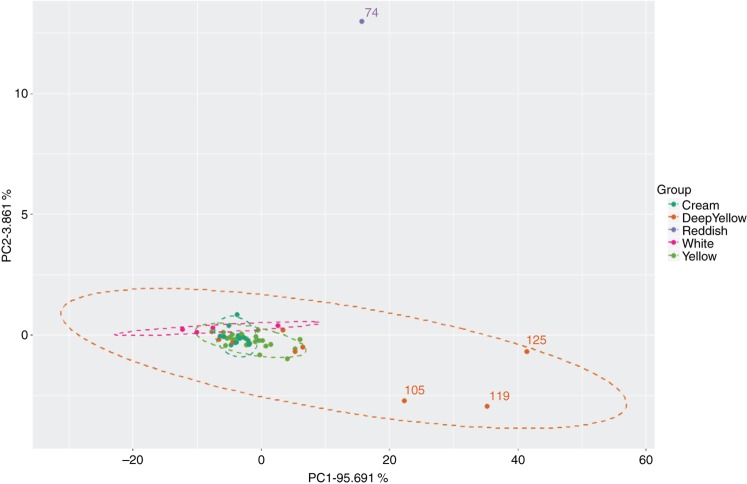
Figure 7:
Scores plot with the distribution of the fifty samples on the first and second PCA components resulting from the UV-visible spectrophotometric data (400–500 ηm) (n =3 replicates). To facilitate the interpretation of the plot, only the sample identifiers for the most relevant samples are shown.

