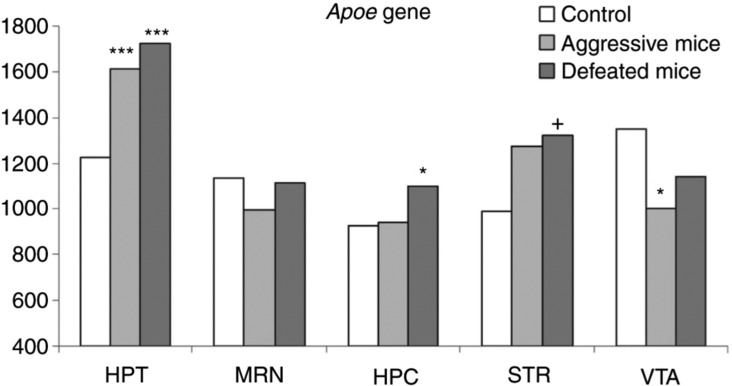
Figure 2:
Expression level of ApoE in 5 brain regions of the control, aggressive and defeated mice. Hypothalamus ApoE expression rate is elevated up to 30 % in affected mice compared to controls and exceeds the average across the regions. HPC, hippocampus; HPT, hypothalamus; STR, striatum; MRN, midbrain raphe nuclei; VTA, ventral tegmental area. *FDR < 0.05; ***FDR < 0.007; +p < 0.053.

