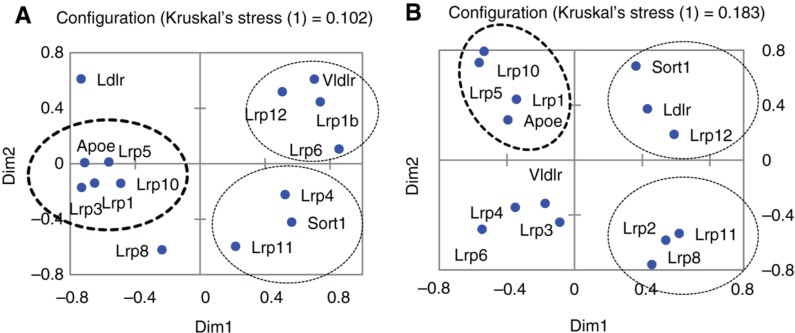
Figure 4:
MDS plot based on Pearson pairwise correlation values of 14 lipoprotein receptors and ApoE expression profiles (A) across 45 samples; (B) across 7 neural cell types [4]. Lrp receptor genes that manifest positive and negative correlations with ApoE expression were observed in accordance with encircled clusters. Bold circles correspond to ApoE – synergistic genes; otherwise, circles correspond to ApoE antagonistic gene clusters. Ldlr and Lrp8 were uncorrelated with ApoE expression rate in (A).

