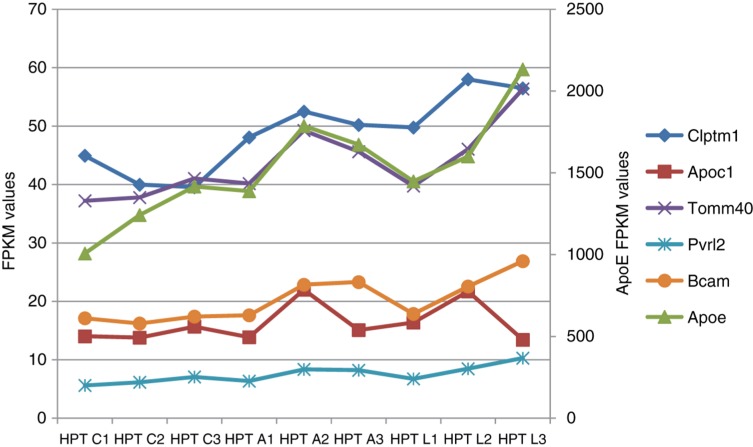
Figure 5:
Expression profiles of 5 genes in the vicinity of the ApoE locus in the hypothalamus (mouse, our data). Ordinate on the right corresponds to ApoE expression level, ordinate on the left corresponds to all other genes. Three animals in each experimental groups (numbered 1–3) were considered for each experiment. HPT, hypothalamus; C1, C2, C3, control group; A1, A2, A3, aggressive mice; L1, L2, L3, defeated mice.

