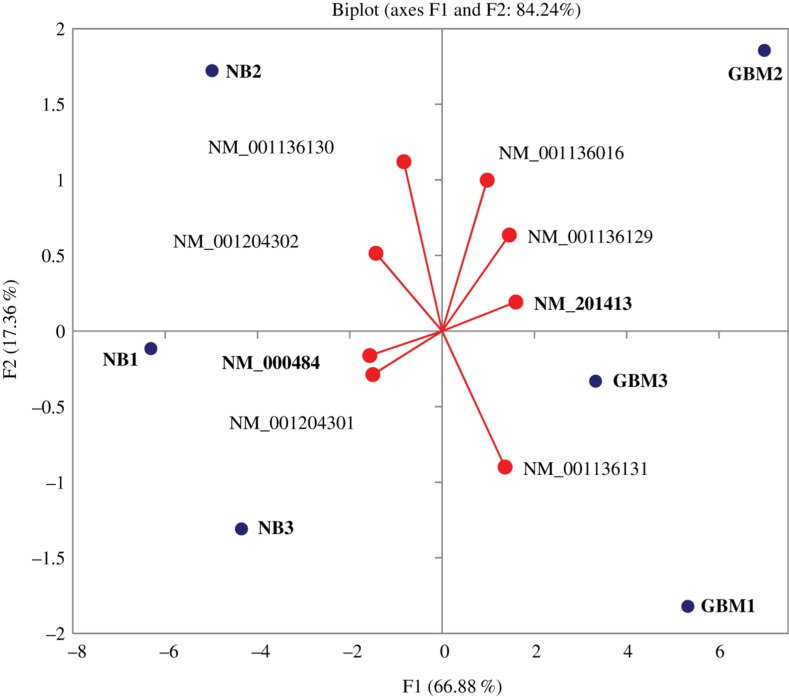
Figure 2:
Distribution of generalized vectors of isoform expressions against samples (NB and GBM) for APP gene. The plot was constructed in the course of Principal Component analysis of isoforms expression profiles (FPKM matrix). The most pronounced differentially expressed isoforms are given in bold. All isoforms on the right are shorter than their closest counterpart on the left (Table 2).

