. 2018 May 1;30(5):667–679. doi: 10.1162/jocn_a_01234

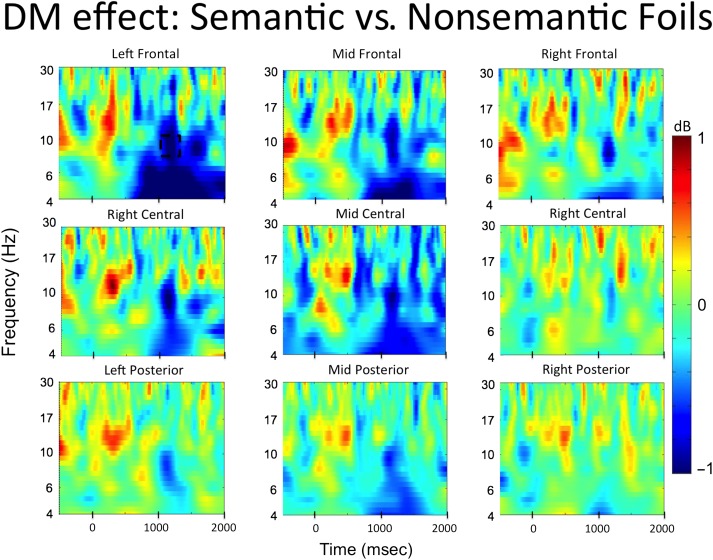
Figure 5. . Time–frequency plots from the left frontal cluster illustrating EEG oscillation differences associated with successful encoding (DM effect) of semantic versus nonsemantic foils during the first memory test (Phase 2). The plot represents the difference of semantic foils later remembered–forgotten versus nonsemantic foils later remembered–forgotten. Permutation testing conducted on the left frontal electrode cluster (indicated by black squares) revealed a significant alpha decrease for subsequently remembered versus forgotten semantic versus nonsemantic foils in the left frontal cluster. The dotted box represents the significant alpha time window that survived correction for multiple comparisons.

Figure 5.